A 3D View of the S&P 500: Price, Time, and Markets
There are lots of valid ways to look at the market. Obviously price is important, but a number alone (e.g., 1487.85—Feb 25th‘s S&P 500 close) doesn’t mean much. Price related metrics like percentage changes and support/resistance levels add value, but adding time as a factor enables some really interesting measures like moving averages and momentum trackers. My favorite time related metric is term structure—how the prices of various options and futures vary depending on their expiration dates.
February 25th‘s market action provided a very interesting set of views.
On the price dimension the percentage moves of the S&P 500 (SPX) and the CBOE’s VIX® index were unusual. At 3:41 EST the SPX was at 1497.7 down 1.21% from the previous close. The VIX on the other hand was up 26.7%, which was -22X the SPX move. The average move is -4.77%, so this was a tad unusual.
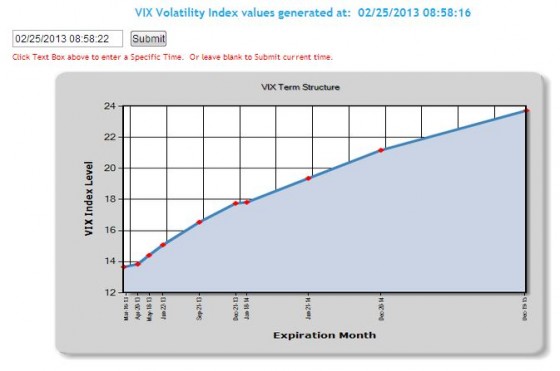
On the time dimension the term structure of SPX options was moving rapidly into backwardation—the implied volatility of the near term options climbing dramatically compared to longer dated options.
At open:
At 3:26 EST:
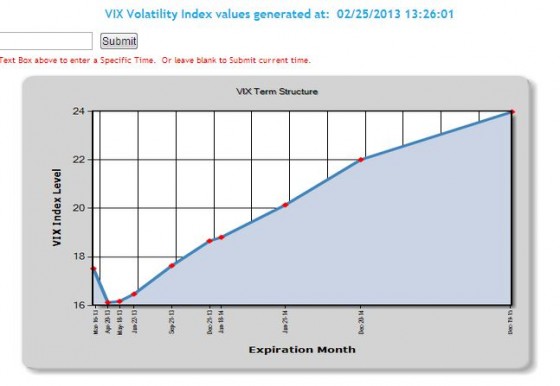
Options in general and SPX options in particular are thought to be traded by more sophisticated investors and institutions. This sort of term structure change indicates they were buying option based protection like mad—even though the market had only fallen 1.21% at the time.
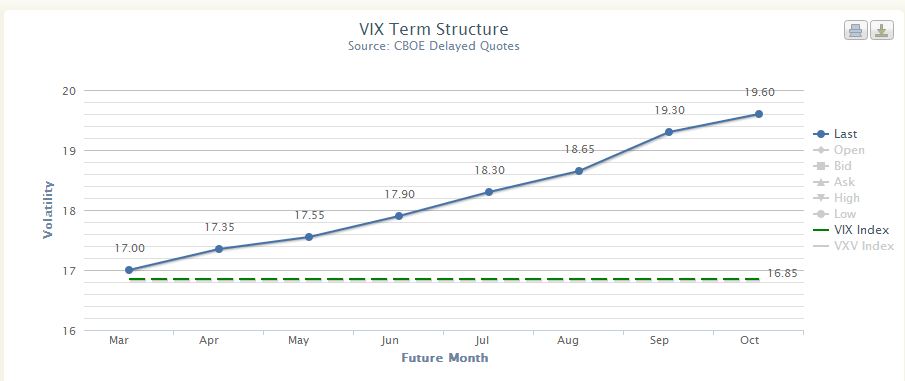
The third dimension that I like to watch is how different markets react to the same set of circumstances. At 2:44 EST the VIX futures market was still unimpressed with the SPX price action of the day—with the term structure looking almost ruler straight.
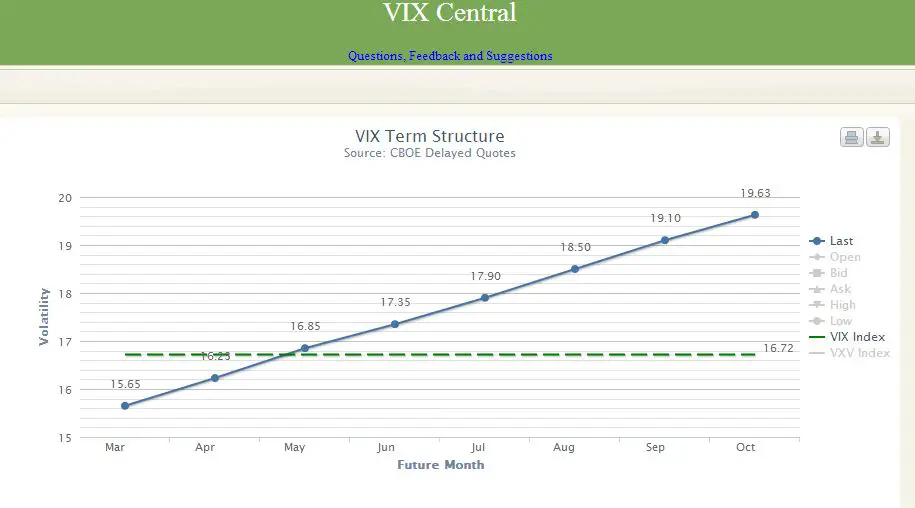
The March front month VIX future was only up 5.4% even though the VIX was up 16.7% at that point—and almost equal to the 3rd month future price. The term structure looked a little different at market close.
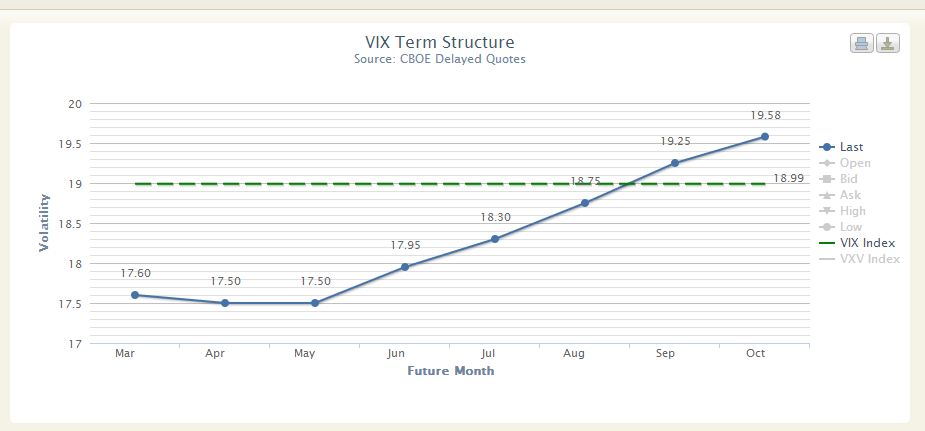
It shows a dramatic shift into backwardation.
Although VIX futures are also linked to SPX options, the linkage is pretty weak. The front month futures only reliably align with SPX options once a month—on the future’s expiration date. Far fewer investors trade VIX futures and they are likely more sophisticated than SPX option traders. Clearly the VIX futures market at 2:44 EST was much less impressed with the general market pullback than the SPX options market.
By market close the VIX futures market was serious about the market move, but judging by the position of the VIX close above the 6th (!) month VIX future value the VIX futures market is still not that worried.
The chart below shows the situation at close on February 26th:
|
 VIXCentral.com |
The VIX dropped 11% and although lumpy the VIX Futures term structure straightened out. For at least 26th the VIX Futures crowd called it right.


Good stuff Six.
Aut beatae eveniet porro accusamus. Corporis nostrum aut nemo magni fugiat ut autem.
Modi molestias qui blanditiis omnis. Fugiat quidem eum qui et vel qui doloremque quaerat. Maiores exercitationem qui distinctio esse. Aut quaerat facilis non fugiat illo aliquam rerum.
Nobis consequatur id repellendus et nostrum. Aspernatur dolores in sit itaque et. Magnam eos voluptas sapiente et aperiam modi.
Quam maxime illo voluptatem sunt qui officiis. Perspiciatis doloribus possimus iusto. Aspernatur in quod aut soluta ipsum. Vel est maiores impedit ut animi et. Illo adipisci mollitia explicabo.
See All Comments - 100% Free
WSO depends on everyone being able to pitch in when they know something. Unlock with your email and get bonus: 6 financial modeling lessons free ($199 value)
or Unlock with your social account...