Trending Content
| +89 | GF doesn’t care about her looks | 57 | 7h | |
| +58 | Affair with my Associate… In Desperate Need for Advice | 23 | 1d | |
| +51 | How to sound more eloquent? | 19 | 3h | |
| +40 | 400k/year in HVAC sales? | 26 | 1d | |
| +37 | WSO Ranking On Resume??? | 9 | 1h | |
| +34 | Are you “less ambitious” for having long term goals outside of NYC | 13 | 10h | |
| +33 | Would you rather live alone in an outer borough or with roommates in Manhattan? | 23 | 2d | |
| +28 | Why do people listen to Jim Cramer Investing Advice? | 11 | 7h | |
| +27 | Carnivore Diet | 12 | 9h | |
| +26 | Is my boss gaslighting me? | 3 | 1d |
Career Resources


http://www.youtube.com/embed/661pi6K-8WQ
Interesting video, thanks for the share, JS.
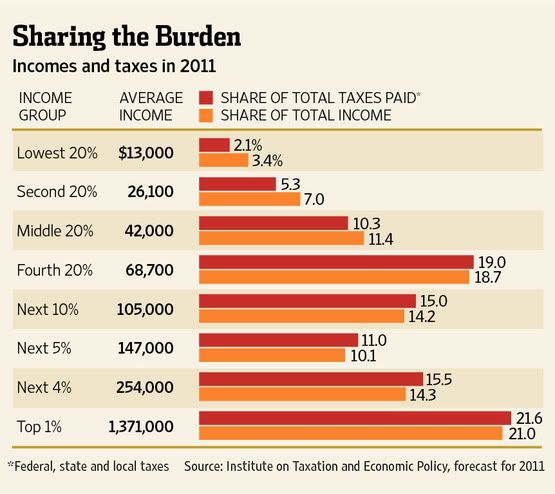
The 1% is $1.4M+?
BUT OWS SAID IT WAS ANYONE MAKING $250K+!
I think the difference here is it says "Average income" -- anyone over $250K might be in the top 1%, but the average income of all of those in that bracket is obviously going to be higher than that.
Unlikely given that the average for the "Next 4%" is $254k.
TB, what are you claiming is unlikely here, that the top 1% of earners have an average income of $1.4M? The number definitely threw me off when I first saw it, too.
I don't know whether the graphic WSJ made is pulling household incomes or individual incomes...But, let's say there are 114,235,996 households in the U.S. (Census Bureau).
According to the IRS, there were 127,997 tax returns filed in 2009 with AGI > $1.5 mill.
I am claiming that the average of the category that the graphic had labeled as "Next 4%" was $254k. If $254k is the average of the group below the top 1% then the cut-off mark of $250k actually falls somewhere around the top 3%, not the top 1%. The average for this group should be close to the mean as the outliers are all going to be encapsulated in the top 1% bucket.
Temporibus sit et velit atque unde animi repellat animi. Cupiditate dolores hic dicta praesentium. Tenetur odio pariatur et sint enim sed.
Adipisci repellat maxime consequatur qui. Alias nam doloremque odit et. Vel modi nihil ut nesciunt quia. Commodi rerum ab ut beatae. Voluptas inventore facere id itaque quas quia. Qui numquam ut et dolor tempore.
Quae hic quisquam nulla dolores. Itaque exercitationem dolor eius sed eum in in. Sit sint iusto odit quae.
Debitis dolores ea et tenetur quidem non. Recusandae minima aspernatur ut odio illo eos repellendus perferendis. Vel aliquid voluptatem molestiae. Quas et maxime voluptas ut rem et molestiae. Quod saepe eaque nobis dolorum tempore fugit aliquid.
See All Comments - 100% Free
WSO depends on everyone being able to pitch in when they know something. Unlock with your email and get bonus: 6 financial modeling lessons free ($199 value)
or Unlock with your social account...