If you have been following my blog postings, you are probably aware that I have an obsession with equity risk premiums (ERP), and have done an annual survey paper on the topic every year since 2008 (with the 2013 update here). I also post a monthly update for the ERP for the S&P 500 at the start of the month on my website. As a consequence, my attention was drawn to a post by Fernando Duarte and Carlo Rosa, economists at the Fed in New York, on the topic.
They argue that equity risk premiums are at historic highs, primarily because the US treasury rates are low, and note that these high equity risk premiums are a precursor to good stock returns in the future. I don’t disagree with their authors that equity risk premiums are high, relative to history and that the low risk free rate is in large part responsible these large premiums, but I am less sanguine about using the ERP as a market timing device, especially at this time in history.
Measurement approaches
There are three ways of estimating an equity risk premium. One is to look at the difference between the average historical return you would have earned investing in stocks and the return on a risk free investment. This
historical premium for the 1928-2013 time period would have stood at about 4.20%, if computed as the difference in compounded returns on US stocks and on the 10-year US treasury bond. (I know. I know. We can have a debate about whether the US treasury is truly risk free, but that is a discussion for a different forum.) The second is to survey portfolio managers, CFOs or investors about what they think stocks will generate as returns in future periods and back out the equity risk premium from these survey numbers. In early 2013, that survey premium would have yielded between 3.8% (from the CFO survey) to 4.8% (portfolio managers) to 5% (analysts). Finally, you can back out a forward looking premium, based upon current stock prices and expected cash flows, akin to estimating the yield to maturity on a bond. That is the process that I use at the start of every month to compute the ERP for US stocks, and
that number stood at 5.45% On May 18, 2013.
What is the ERP?
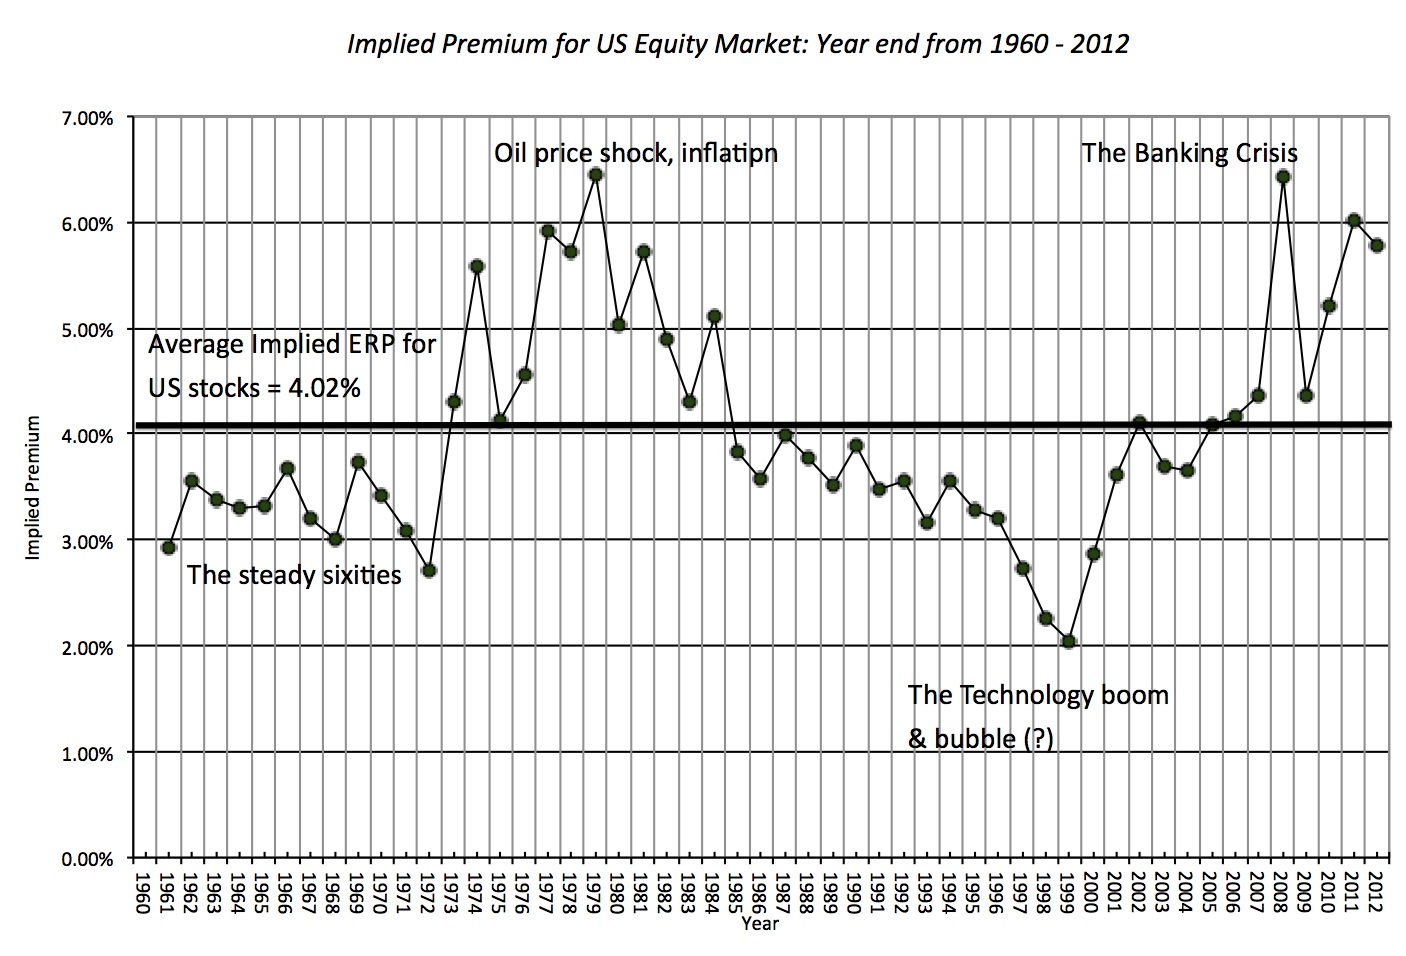
The equity risk premium is the extra return that investors demand over and above a risk free rate to invest in equities as a class. Thus, it is a receptacle for investor hopes and fears, with the number rising when the fear quotient dominates the hope quotient. In buoyant times, when investors are not fazed by risk and hope is the dominant force, equity risk premiums can fall. In the graph below, you can see my estimates of the implied equity risk premium for US stocks from 1961 to 2012 (year ends) with annotations providing my rationale for the shifts over time periods.

The average implied equity risk premium over the entire period is 4.02% and that number is the basis for the bullishness that some investors/analysts bring to the market. If the equity risk premium, currently at 5.45%, does drop to 4.02% , the S&P 500 would trade at 2270, an increase of 26.5% on current levels. And history, as Duarte and Rosa note, is on your side, albeit with significant noise, in making this assumption that equity risk premiums revert back to norms over time. As I will argue in the next section, the high ERP in 2013 is very different from high ERPs in previous time periods and extrapolating from past history can be dangerous.
A Fed-engineered ERP?
This equity risk premium, though, is over and above the risk free rate. To provide a sense of the interplay between the risk free rate and the equity risk premium, I
plot the expected return on stocks (based upon future cash flows and current stock prices), decomposed into the equity risk premium and the and the risk free rate each year from 1962 to 2012.
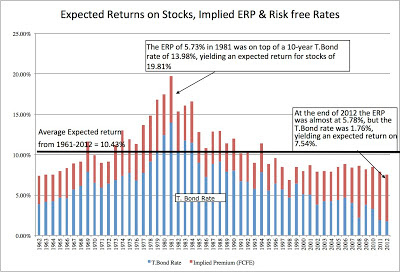
Over the last decade, the expected return on stocks has stayed surprisingly stable at between 8-9% and almost all of the variation in the ERP over the decade has come from the risk free rate. In particular, the higher ERP over the last five years can be entirely attributed to the risk free rates dropping to historic lows. In fact, the
expected return on stocks on May 18, 2013 of 7.40% is close to the historic low for this number of 6.91% at the end of 1998.
So what? While the relationship between the level of the ERP and the risk free rate has weakened over the last decade, the two numbers have historically moved in the same direction: as risk free rates go up (down), equity risk premiums have risen (fallen). In fact, a regression of the ERP on the ten-year US treasury bond rate from 1960-2012 is presented below:
ERP = .0348 + .0842 (US T. Bond Rate) R squared = 4.68%
(1.57)
Thus, an increase of 1% in the ten-year bond rate (from 2% to 3%, for instance) increases the ERP by 0.0842%. In fact, running the regression through from 1960-2003 (excluding the last decade) yields an ever stronger result:
ERP = .0202 + .2592 (US T. Bond Rate) R squared = 43.52%
(5.62)
During this period, a 1% increase in interest rates would have led to an increase of 0.26% in the ERP. The last decade has weakened the relationship between the ERP and the T.Bond rate dramatically.
In light of this evidence, consider again two periods with high ERPs. In 1981, the ERP was 5.73%, but it was on top of a ten-year US treasury bond rate of 13.98%, yielding an expected return for stocks of 19.71%. On May 1, 2013, the ERP is at 5.70% but it rests on a US treasury bond rate of 1.65%, resulting in an expected return on 7.35%. An investor betting on ERP declining in 1979 had two forces working in his favor: that the ERP would revert back to historic averages and that the US treasury bond rate would also decline towards past norms An investor in 2013 is faced with the reality that the US treasury bond rate does not have much room to get lower and, if
mean reversion holds, has plenty of room to move up, and if history holds, it will take the ERP up with it.
In the table below, I list potential consequences for the S&P 500, in terms of percentage changes in the level of the index, of different combinations of the risk free rate and the ERP:

Thus, if risk free rates move to 3% and the equity risk premium drops to 5%, the index is undervalued by about 5%, but if rates rise to 4% and the equity risk premium stays at 5.5%, the index is
overvalued by 8.28%. There is another interesting aspect to the table that bears emphasizing. While the sum of the risk free rate and equity risk premium is the expected return on stocks, stocks are worth much more for any given expected return, if more of that expected return comes from the risk free rate. In the figure below, note the S&P index levels for an expected return of 9%, using different combinations of the risk free rate and ERP:

Thus, the same mean reversion that market bulls point to with the ERP can be used to make a bearish case for stocks. The historical average expected return for stocks between 1960 and 2012 of 10.43%, this would translate into the S&P 500 being over valued between 12-40%, depending upon the composition of the expected return. In fact, that is the reason that you have the
large divergence in the market between those who use normalized
PE ratios and argue that stocks are massively overpriced and those who use the equity risk premium or the Fed model today to make the opposite case. I am sure that you have your own views on both where the risk free rate and the equity risk premium are headed. If you want to explore the effect on stock prices of changing the variables,
please use the linked spreadsheet.
Bottom line
In a previous post, I noted that stocks do not look over priced. While you may feel that this post is in direct contradiction, let me hasten to provide the bridge between the two. In the prior post, I noted that stock prices are being sustained by four legs: (1) robust cash flows, taking the form of dividends and buybacks at historic highs for US companies, (2) a recovering
economy (and earnings growth that comes with it), (3) ERP at above-normal levels and (4) low risk free rates. Thus, my argument is a relative one: given how other financial assets are being priced and the level of interest rates right now, stocks look reasonably priced.
The danger, though, is that the US T.Bond rate is not only at a historic low but that it may be too low, relative to its intrinsic level, based upon expected inflation and expected real growth (a topic for another blog post coming soon). If you believe that the T.Bond rate is too low, then you have the possibility that you are in the midst of a Fed-induced market bubble(s) and that script never has a good ending. The scary part is that there are no obvious safe havens:
gold and silver have had a good run but don’t seem like a bargain and central banks around the world seem to
be following the Fed’s script of low interest rates. You could use derivatives to buy short term insurance against a market collapse but, given that you are not alone in your fears about the market, you will pay a hefty price.
There is a middle ground. In my last ERP update, I argued that stock market investors were dancing to the Fed’s tune and wondering whether the music would stop. Let me rephrase that. If the market is dancing to the Fed’s tune, it is not a question of whether the music will stop, but when. When long term interest rates move back up, as they inevitably will, the question of how much the equity markets will be affected will depend in large part on whether the ERP declines enough to offset the
interest rate effect. Thus, while I would not be arguing that stocks are cheap, simply because the ERP today is higher than historic norms, I am not ready to scale down the equity portion of my portfolio (especially since I have no place to put that money). Looking at the table of
market sensitivity to risk free rate/ERP combinations, there are enough soft landing scenarios for the market that I will continue to buy individual stocks, while keeping an eye on the ERP & T.Bond rate.


Professor - any idea as to the cause(s) behind the weakened relationship between the ERP and T.Bond rate? Would you say that the Fed shoulders most of the blame for this?
I saw a chart on Bloomberg TV today (forgive me as I could not find it to link) demonstrating the outperfomance of companies that are repurchasing shares vs. those that have not. Obviously, the differential was significant, but I am skeptical as to the cause and effect.
Meaning, if a company has the means to repurchase shares (i.e. significant free cash flow), wouldn't that drive outperfomance relative to other equities to begin with?
Central banks printing of the fiat currencies, the debasement of assets, if continued, is a recipe for disaster.
Fantastic article.
I tend to agree with your 'bottom line' -- I, too, think there are enough 'soft landing' scenarios where the risk-reward on certain equities still looks quite good. The trick for central bankers, of course, will be passing the baton between valuations rooted in QE and valuations rooted in fundamentals. If rates go up but the economic situation improves (or at minimum appears to be self-sustaining), and fundamentals warrant an ERP more in line with the historical average then we might not see the implosion some hedge fund managers were hoping to see. Indeed, based on your chart, we would have some room to run. (Of course, for the foreseeable future, as an equity investor I would absolutely demand a slightly elevated ERP to participate in this central bank experiment).
In any case, we are definitely living in interesting times. Thank you for sharing your analysis, Professor.
I love this guy. Cool that he's posting here on WSO. Years ago I used to "pirate" his Excel models to help me at work.
A variation of your metric, LERP (Levered ERP) is also handy. LERP is the spread between the current earnings yield of an equity index and the average OAS for high yield bonds (I use Barclays US Corp HY Average OAS). This way you're backing out any liquidity premia and much of the credit risk.
ERPs are debatable as a tool for 'market timing', but they are excellent for relative value measures. Where do you allocate your marginal dollar: SPX, R2K, or high yield?
Nice charts! Market is like a bucket of water, some sees half full, the other sees half empty. Change the assumption, change the value of the result. The tricky part is the future depends on what lies ahead.
How to find the Equity Risk Premium ? (Originally Posted: 04/18/2014)
Hello !
I'm searching the ERP for the french market, and it's very difficult to find it !! Do you know a way to find it on Thomson One ? And in Investment Banking or Private Equity, what tools are used to find the ERP ?
Thanks :)
http://pages.stern.nyu.edu/~adamodar/New_Home_Page/datafile/ctryprem.ht…
You can calculate it yourself using Damodoran's method, or just ask whatever your peers think. His methods are available on site and are considered pretty much the textbook way of doing things.
A little outdated but here:
http://psc.ky.gov/pscecf/2012-00221/[email protected]/10252012…
Thanks a lot ! The french premium from Damodaran is dated from January, isn't it too much far ?
And what do you think of taking the ERP from Fairness Opinion or Brocker Notes ?
Qui et minus ipsum nisi non adipisci iure aut. Quo facilis odit est voluptas eveniet. Excepturi quisquam corporis odio. Voluptates tenetur mollitia ab et. Possimus fuga dolor ut praesentium exercitationem sit et maiores. Tenetur optio ipsam recusandae quo iure dolores magni.
Voluptatem quia ipsam totam rerum adipisci et. Sed dolore non rerum voluptatem quia iure dignissimos. Rem quod consequatur at possimus. Eligendi est blanditiis quia ut quisquam rem repellendus.
Qui sed velit dolores doloribus. Ea totam et consequatur inventore culpa distinctio.
Sed corporis est velit error sint. Ut nulla est deserunt iusto. Provident vel error et dicta totam enim. Sunt soluta fugiat dolor ab.
See All Comments - 100% Free
WSO depends on everyone being able to pitch in when they know something. Unlock with your email and get bonus: 6 financial modeling lessons free ($199 value)
or Unlock with your social account...