The Cost of Contango—it’s not Buy High, Sell Low
A while back I developed a spreadsheet that consolidates the CBOE’s historic VIX futures data into a single spreadsheet. Using this spreadsheet I calculate the short (SPVXSTR) and medium term (SPVXMTR) rolling indexes that underlie the various volatility Exchange Traded Products (ETP) like VXX, UVXY, XIV, and ZIV The image below shows a small sample comparing my calculations (M1-M2 Short Term Rolling Index) with the official value of the short term index.
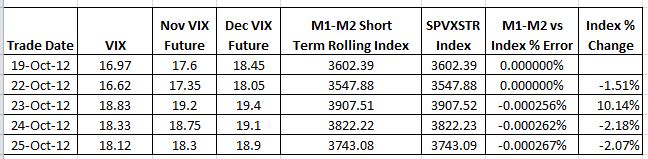 |
The percentage differences between my index and the official index (e.g, -0.000256%) aren’t cumulative and are probably due to rounding.
Once I had verified my index calculations I wanted to look at the nemesis of the long volatility funds like VXX and UVXY—yield losses. These losses, which can be 5% to 10% per month occur when the CBOE S&P 500 Volatility Index (VIX) Futures that underlie these ETPs are more expensive for longer dated contracts compared to the shorter term contracts. This situation is called contango, and is typical when the overall market is bullish or flat. The graph below from VIX Central shows VIX Futures in a contango configuration.
|
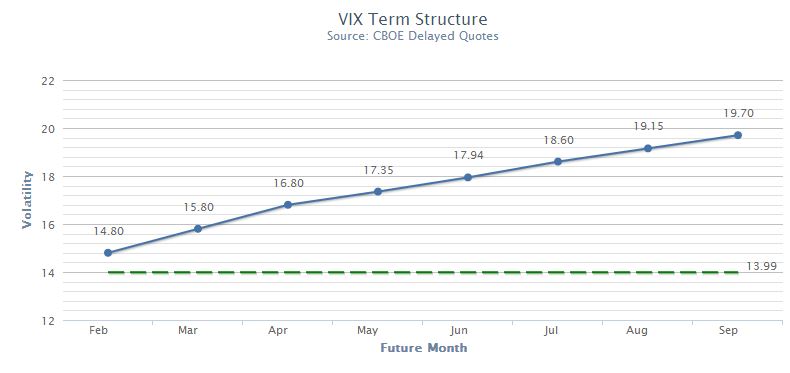 vixcentral.com |
I wanted to quantify this loss with my spreadsheet without the noise of everyday volatility moves, so I left the term structure in contango, but held the futures prices constant in my spreadsheet from day to day as an experiment. The results were surprising.
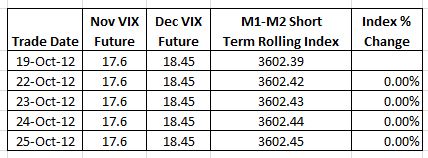 |
My calculations showed no daily roll costs in the index. The 0.01 upticks in the index are due to treasury bill interest.
The usual explanation for roll costs, discredited in the sample above, asserts that losses are incurred when funds sell cheaper shorter term contracts and buy more expensive longer term contracts every day as specified by the indexes they follow—a sell low, buy high situation. A closer look illustrates the flaw in this explanation. A simple example of a $10 million position after market close on 19-Oct-12— after the contract rolls. Fractional contracts aren’t supported, so unused money goes in the cash bucket.


I'm really confused with how you calculated roll yield.
Why don't you take total return then susbtract change in spot and collateral yield. Then do that over a sample of periods and take an average so we have an impression.
Just by eye it looks like there is a roll yield or at least some other effect when spread btw. NOV & DEC changes constantly.
I actually didn't try to calculate the roll yield. As the 2nd comment suggests using the spot vs front month ratio gives a reasonable result. The point of my post is that the roll yield of the long vol ETPs is not due to the daily roll of futures--a wide spread belief. Apparently some people don't think they need to actually read something before they bring their master intelligence to bear...
It's certainly not impossible for M1 & M2 futures to stay the same value for several days. The simulation showed in that case there would be no roll costs. Of course normally they decrease, as the graph later in the post demonstrated.
I think you may be confused about the difference between days to maturity left on a future vs. the maturity date of a future. If I hold the vol and maturity date constant while moving forward in time, the future will roughly earn the risk free rate. You can't assume that the 1 month future and the 27 day future have the same value all else constant. They don't. These ETNs are death by a thousand cuts.
It's not complicated dude. Spot = 14.8. Front month = 15.8. Negative carry = 14.8/15.8-1 = -6%
QED.
Are you fucking kidding me? You held the vol constant and you're surprised that the prices aren't changing? Don't you see in the chart how implied vol is higher the further you go out? That means that if everything stays the same, the futures will come down in price as time passes. In other words, there's negative roll yield as the longer dated futures become shorter dated futures.
If you don't believe me, even the prospectus states that the expected value of these things is zero. It must be called "six figure investing" because you started with seven figures.
If you look closely at the case where I hold vol constant the index increases slightly each day--at the risk free rate. The death by a thousand cuts parts, which I agree with completely, is captured in the index itself as the futures drop in value. That's why I been long ZIV most of the time since September...
Quia quia fugiat laboriosam possimus doloremque qui veniam. Aspernatur modi dicta error atque. Voluptates porro nam ut. Sit illo ut voluptas maxime. Minima doloribus mollitia rerum est dolores. Consectetur et iusto non vitae minima quidem hic. Eos eius animi nemo fugit perferendis hic quos.
See All Comments - 100% Free
WSO depends on everyone being able to pitch in when they know something. Unlock with your email and get bonus: 6 financial modeling lessons free ($199 value)
or Unlock with your social account...