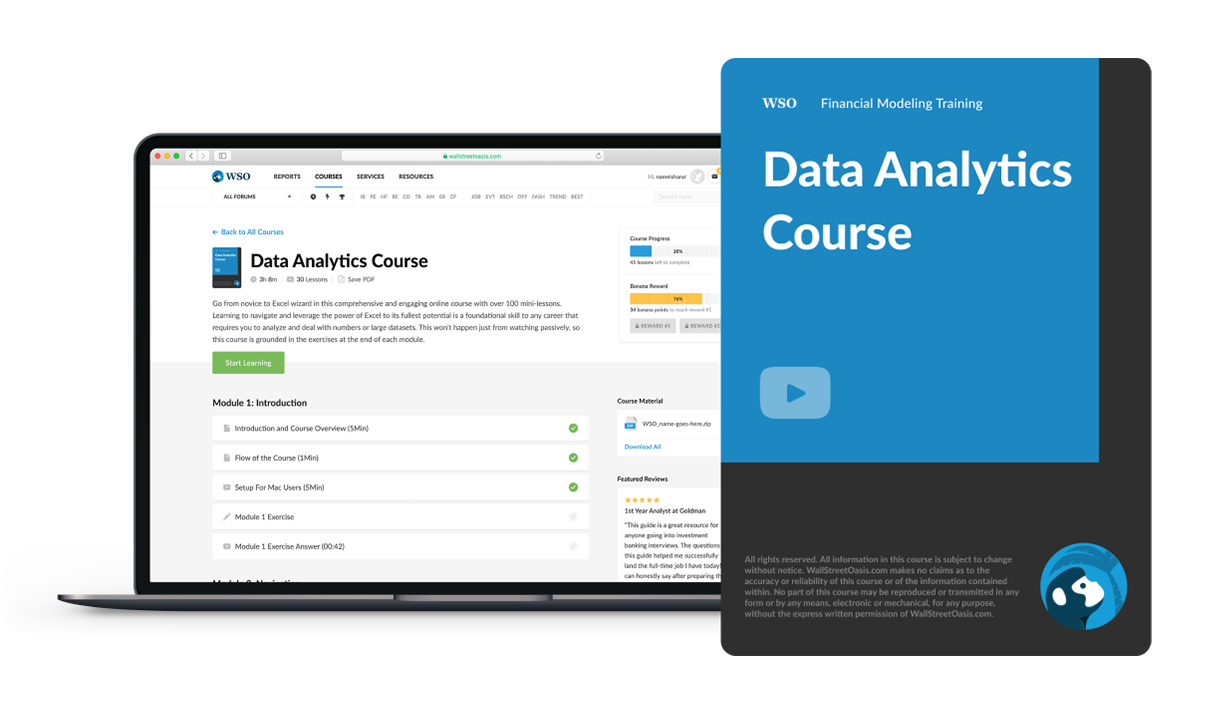
DATA ANALYTICS COURSE
Introducing...
50+ Lessons, 10+ Modules, 4+ hours of video lessons
To Help you Thrive in the Most Prestigious Jobs on Wall Street...
HERE’S JUST SOME OF WHAT YOU’LL GET IN THIS COURSE
Statistics Fundamentals (7 video lessons)
In this module, we use 7 video lessons to explain statistics fundamentals such as Standard Deviation and Correlation and their applications. This includes real examples to make sure you understand how to apply the concepts you learn.
Regression (3 video lessons)
In this module, we use 3 video lessons to learn regression analysis to analyze the relationship between two variables. We wrap up this module by exploring the conclusive evidence we can derive from regression analysis.
Simple Analytics (4 video lessons, 1 exercise)
In this module, we use 4 video lessons to dive into our data analytics Bootcamp by exploring some simple analytics we can concur from the data set. This module also includes a step-by-step walkthrough of using excel to work through the data set.
Descriptive Analytics (3 video lessons)
In this module, we use 3 video lessons to explore how we can use analytics to create a narrative within our data. This module also includes a walkthrough on how to create a histogram distribution to visually show our data.
Pareto Analysis (4 video lessons, 1 exercise)
In this module, we use 4 video lessons to explain how we can use Pareto analysis in order to find inconsistencies within our data. This module also includes a guide on how to use pivot tables to conduct Pareto analysis in Excel.
Correlation (3 video lessons, 1 exercise)
In this module, we use 3 video lessons to dive into the correlation between gender and salary within our company data set. We wrap up this module by exploring other inferences we can conclude from our data set.
Revisiting Regression (5 video lessons, 1 exercise)
In this module, we use 5 video lessons to revisit regression analysis using a different data set. In this module, we use a new Excel plug-in Analysis Tookpack to create more advanced regressions using our data and create a predictive model using our findings.
Looking at Data Differently (3 video lessons, 1 exercise)
In this module, we use 3 video lessons to visit our original data set to look at our data through a different lens. This module also includes a step-by-step guide on how to create a calculated field.
Turnover and Tenure (10 video lessons, 2 exercise)
In this module, we use 10 video lessons to combine all the skills from previous modules by applying them in turnover and tenure calculations. This module includes a comprehensive exercise with aggressive benchmarking and a video solution to make sure you have true mastery.
Displaying Data (6 video lessons, 1 exercise)
In this module, we use 6 video lessons to explore how we can visually present our conclusions and data in Excel through a Dashboard. We wrap up this module with a guided walkthrough on how to create a dashboard, an excellent skill that can be explored more in the WSO Excel Dashboards & Power BI course.
WSO Data Analytics Course - Video Preview
Course Summary - Table of Contents
Below you will find a list of the modules and lessons included in this course.
- Introduction to the Course (2Min)
- Intro to Big data (7Min)
- Into to Data Analytics (4Min)
- Types of Analytics (6Min)
- Stats Bootcamp - Avg Min Max (3Min)
- Histogram (2Min)
- Standard Deviation (4Min)
- Standard Deviation Rules of Thumb (3Min)
- Correlation (6Min)
- Scatter Plot (5Min)
- Equation of the Line (4Min)
- Regression Analysis Introduction (3Min)
- Regression Analysis Parts (8Min)
- Regression Analysis Conclusion (3Min)
- Introducing the Data and Problem (4Min)
- Simple Analytics I (5Min)
- Simple Analytics II (6Min)
- Simple Analytics III (8Min)
- Drilling Into Descriptive Analytics (6Min)
- Drilling Into Descriptive Analytics II (4Min)
- Creating and Interpreting a Histogram (5Min)
- Pareto Analysis I (6Min)
- Pareto Analysis II (3Min)
- Pareto Analysis III (6Min)
- Pareto Analysis and Section Conclusion (5Min)
- Correlation - Preparing Our Data (4Min)
- Calculating and Interpreting Correlation (6Min)
- Asking More Questions (5Min)
- Scatter Plot (6Min)
- Analysis Toolpack, Correlation, R-Square (5Min)
- P-Value (3Min)
- Creating a Model (2Min)
- Confidence Interval (5Min)
- Looking at Data in a Different Light (3Min)
- Creating a Calculated Field (6Min)
- Looking at Data Through a New Lens (4Min)
- Drilling into Turnover (6Min)
- Drilling into Turnover II (4Min)
- Calculating Tenure at the Firm (5Min)
- Tenure at the Firm II (5Min)
- Tenure at the Firm III (6Min)
- Discovering Our Answer (6Min)
- Quantifying Our Recommendation (2Min)
- Calculating Overall Turnover Cost (7Min)
- Calculating Maternity Turnover Cost (3Min)
- Calculating Maternity Leave Cost (4Min)
- Calculating the Final Benefit (6Min)
- Creating a Data Table (5Min)
- Creating a Data Table II (3Min)
- Dashboards (6Min)
- Dashboards II (6Min)
- Dashboards III (4Min)
- Dashboards Conclusion (6Min)
- Data Analytics Outro (3Min)
Our students have landed and thrived at positions across all top Wall Street firms, including:

Don’t Take Our Word For It
Hear from a few of our 57,000+ students...
Hear from a few of our 57,000+ students...
It is clear that WSO has delivered yet again! The course layout is very clear and follows a logical progression. At the same time, it is very efficient and focused on delivering the main concepts and ideas integral to the field of data analytics.
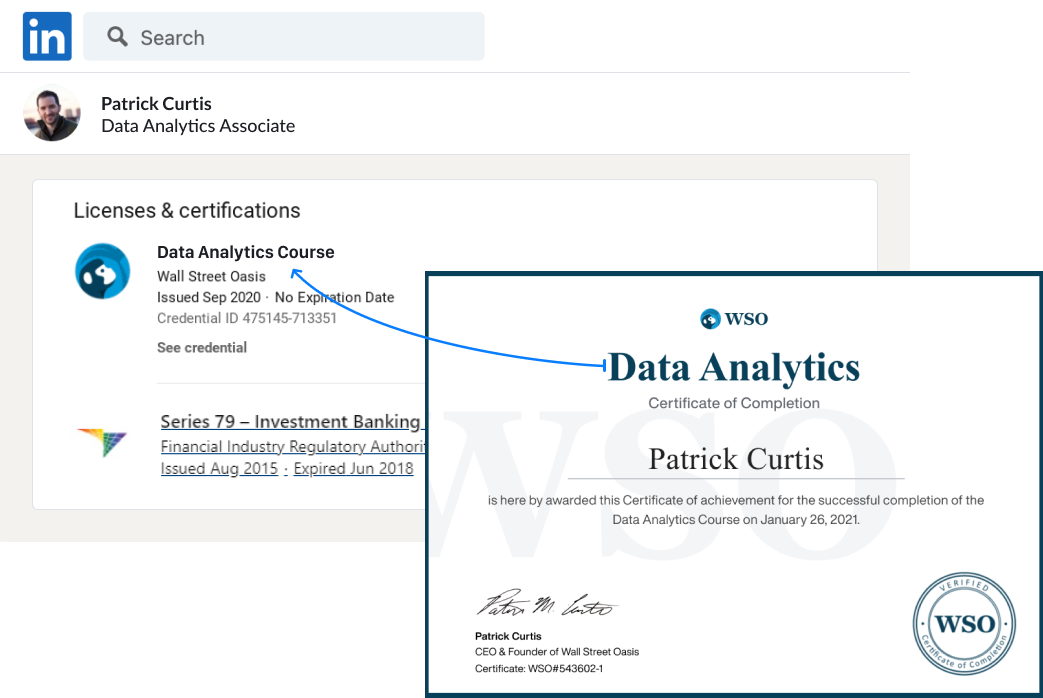
Get the Data Analytics Course Certification
After completing the course, all students will be granted the WSO Data Analytics Course Certification. Use this certificate as a signal to employers that you have the technical Statistics skills to immediately add value to your team.
Demonstrate that you have put in the work outside of university courses to make yourself more efficient and master the most critical program for success in finance careers. Easily share to LinkedIn and other social media sites to highlight your skills and strengthen your profile as a candidate.
How Much is Your
Finance Career Worth?
What You Get |
Value |
|---|---|
WSO Data Analytics Course 50+ video lessons across 12 Modules taught by an expert Big 4 Auditor with a CPA... |
$500 |
8 Interactive Exercises Gain realistic practice drilling the concepts taught in the course so that you can apply them in the real world. |
$450 |
24 Months of Unlimited Elite Support from Actual Finance Pros Have a technical question? Easily drop a comment into any lesson and get a response from a pro within 48hrs. |
$300 |
6 Months of FREE Access to Macabacus Full access to this Excel plug-in that makes financial modeling even easier, including tools for PowerPoint and Word. |
$120 |
TOTAL VALUE |
$1,370 |
Get Unlimited Lifetime Access To The WSO Data Analytics Course For 93% Off
$1,370
$97
...or get access today for only $37
Secure checkout
100%
Unconditional Money-Back Guarantee

12 Month Risk-Free Guarantee
Your investment is protected by our 12-Month Risk-Free Guarantee. If, for any reason, you don’t think the WSO Data Analytics Course is right for you, just send us an email, and we’ll refund every penny. No questions asked. In short, you get a great return on your investment, or you get your money back. It’s that simple.