Where’s inflation?
Two camps exist regarding the inflation debate. Some believe higher prices are right around the corner, awaiting some mystical catalyst. Yet others argue that this time is structurally different, citing a range of factors such as the rise of e-commerce and its downward force on retail prices, unconventional global monetary policy, or anemic wage growth. For the remainder, I will focus on the latter.
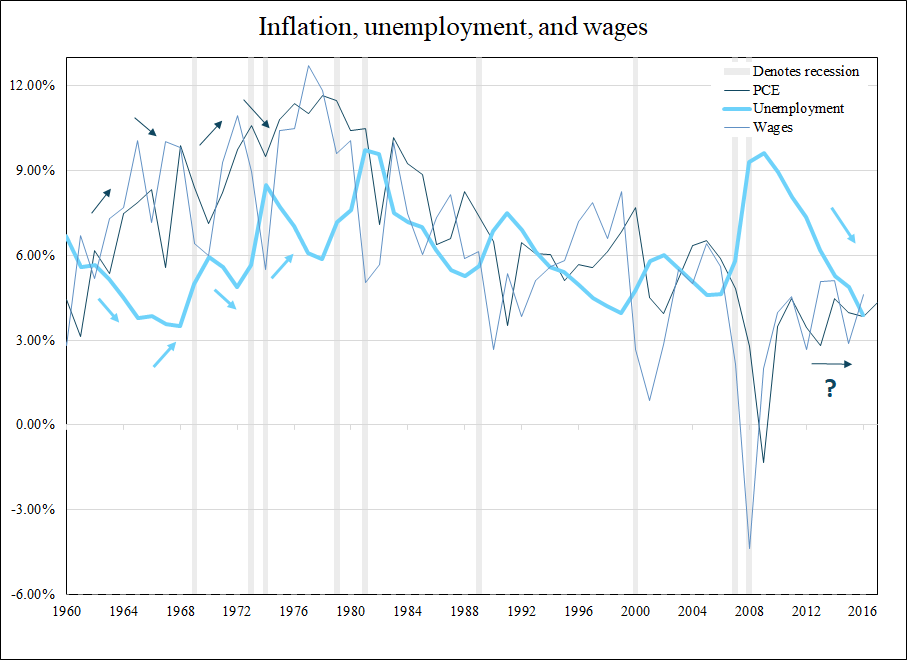
But first, let’s take a quick look at the numbers. CPI and PCE measures of inflation have averaged 3.5% and 6.7% historically. Neither have reached this level once since the end of the Great Recession. Alongside, wage growth has yet to come within breathing distance of its 6.2% long-term mean.
But here’s the kicker: the latest unemployment print of 3.9% is the strongest since 1969. Typically, as you can see in the chart below, that would signal sufficient tightness for wage gains and thus inflation.
Source: Bureau of Labor Statistics, Federal Reserve
The relationship between inflation, unemployment, and wages
Legend has it that as the labor market tightens, wages rise, and inflation follows. The logic is as follows: as the supply of unemployed workers falls, businesses are forced to pay up for additional labor. And all else equal, larger salaries should equate to greater aggregate demand for a constant supply of goods. This is one definition of inflation.
This relationship -- and particularly the Phillips curve, which inversely relates the unemployment rate with wage growth -- has come under special scrutiny this economic cycle with record levels of employment failing to generate substantially higher pay. In analysts’ eyes, the break in this linkage is the cause for recent history’s disinflation.
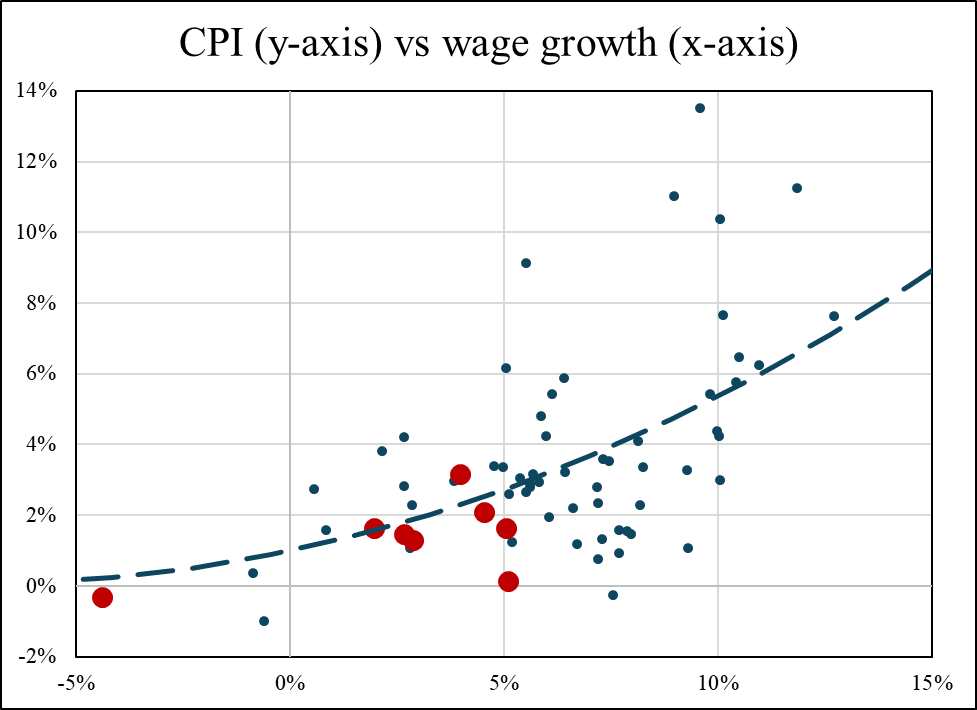
Exacerbating this, inflation has undershot wage growth seven out of the past nine years. Not only is record unemployment struggling to produce higher wages, but what little wage growth there has been has not materialized in historical levels of inflation. Post-recession data points in the chart below are enlarged and in red.
Source: Bureau of Labor Statistics
So what gives?
When World War II ended, everybody was happy, which naturally resulted in tons of babies being born. For perspective, the peak post-World War II annual birth rate of 27.5 per 1,000 women is more than twice today’s rate of 12.4. From this the “baby boomer” generation was formed. It is my view that we should be blaming them (or perhaps more appropriately, their parents) for the lack of inflation.
The precise range for what a baby boomer is depends on the source, but is roughly considered to be someone born between the end of the second World War and the mid-60’s. As such, this generation began to enter the workforce around 1960 and reached full saturation in the early 80’s. The impact of this lump in the population manifests through a steady increase in the median employed age from just over 35 in 1980 to around 42.2 as of the most recent data. Additionally, observe how the “over 65 years old” demographic has grown over time, and is projected to accelerate through 2030 by the Bureau of the Census.
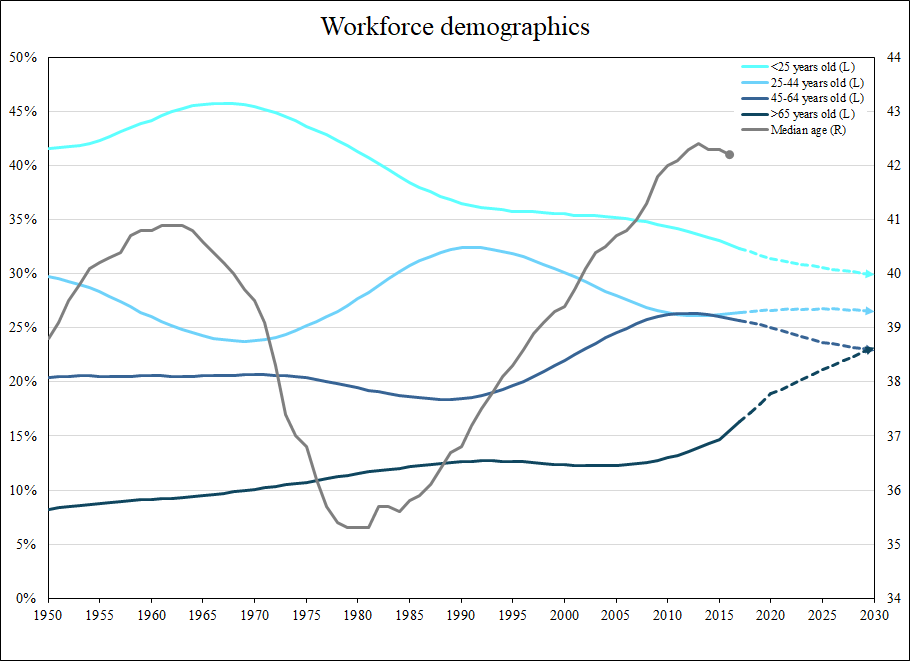
Source: Bureau of the Census, Bureau of Labor Statistics
Not only is the oldest segment of the workforce growing the quickest, but it has also garnered the lion’s share of wage gains in the current economic cycle. Pay for this group grew at a CAGR of 4.0% since 2008, compared to 2.5% overall or 1.9% for the rest of the economy.
As this cohort continues to grow older and richer, its already low marginal propensity to consume will fall. Discretionary purchases like cars and clothes increasingly give way to saving for retirement and storing wealth to pass down.
No wonder, then, that these meager wage gains have led to less-than-expected inflation. Most of the money is going to the age group who spends the least!
Future implications
Looking forward, this population trend is forecast to continue in earnest through 2030. Keeping salary growth rates constant at the post-recession level (perhaps a dubious prediction, but I prefer to minimize assumptions), wage growth should average a slightly higher 2.7% moving forward. Before you get excited, the historical average is 6.2%.
This corresponds to a CPI print of 1.8% using the above regression, and the risks to this number are to the downside. With an even greater portion of aggregate pay increases projected to go to the middle-aged, the transmission to inflation may be proportionally smaller. The same regression predicts 1.2% when adding the mean post-2009 deviation. While I believe this number is a little low, I think a compromise of 1.5% give-or-take is an appropriate forecast.
Eventually, the most likely scenario is our next recession (whenever that is) has a disproportionately high impact on the middle-age bracket of employees, purging many from the labor force. The highest-paid are typically the first to go. Laid-off baby boomers’ salaries slowly turn into raises for the younger population, and things proceed from there as normal. But until then, expect disinflation to be the norm because at the end of the day, finance is the movement of money through space and time, and it is people – not “market forces” or complex econometric models – that do the moving. Or in this case, saving.
Content:
- To import a Word document, simply copy and paste into the editor.
- To insert a video or other embed, simply paste share link in new line and press Enter.
