Security Market Line (SML)
It plots the relationship between an asset’s expected return and beta and represents the expected return for bearing systematic risk


What Is the Security Market Line (SML)?
The security market line (SML) plots the relationships between an asset's expected return and beta. It represents the expected return for bearing systematic risk. Generally, stocks with high betas (systematic/unsystematic risk) carry greater expected returns.
The mathematical representation of the SML is the capital asset pricing model (CAPM) formula.
In the case of Individual stocks and portfolios, modern portfolio theory suggests that investors get compensated for only bearing systematic risk.
Under the CAPM context, all investors are rational and will choose to invest in a combination of market and risk-free portfolios or a bundle of securities that form part of the overall market portfolio.
A market portfolio is a theoretical bundle of investments that includes every type of asset available in the investment universe. Hence, it is safe to assume that no investor will choose to hold a risky asset that is not included in the market portfolio.
Moreover, individual risky investments are assumed to be correctly priced based on how much risk they contribute to the total market portfolio risk. This important statement allows us to derive the following formula for pricing risky individual assets, also known as the CAPM:
E( ri ) = rf + ßi [ E( rm ) - rf ]
Where:
- E( ri ) is the individual asset i's expected return
- rf is the risk-free rate of return
- E( rm ) is the market portfolio m's expected return (or just expected market return)
- [ E( rm ) - rf ] is the expected market risk premium
- ßi is defined as a stock's beta or systematic risk
Good proxies for the market portfolio are broad-market indices, such as the Wilshire 5000 in the US, or multi-market indices, such as the S&P Global 1200, which tracks 7 broad-market indices, 95% of the market cap of 30 countries, or 70% of the world market cap.
Key Takeaways
- The SML depicts the relationship between an asset's expected return and beta, representing compensation for bearing systematic risk.
- The risk and reward relationship indicates that investors prefer lower-risk strategies when faced with similar expected returns.
- Capital Markets Line (CML), tangent to the efficient/portfolio frontier, showcases risk-return combinations for portfolios with risk-free assets.
- SML helps identify if a security is overvalued or undervalued based on its position relative to the line.
Understanding the Security Market Line (SML)
To have a solid understanding of the SML, it is important first to know the difference between systematic vs. unsystematic risk, the risk and reward relationship, what type of risks get rewarded, and the concept behind the capital markets line (CML).
1. Systematic vs. Unsystematic Risk
Unsystematic risk can be considered a company-specific risk or risk unique to a specific asset but can be easily diversified away. On the other hand, the systematic risk can't be easily diversified away since systematic risk stems from economy-wide factors, such as a global recession.
2. Risk and Reward Relationship
The risk and reward relationship states that when an investor is faced with two investment options of similar expected returns, they will pick the one with a lower risk or a lower variance strategy.
However, this investor will pick a higher-risk strategy and is rewarded with a higher expected return. In other words, the higher the risk, the higher the expected return.
3. What Type of Risk Gets Rewarded?
A company's total risk equals the sum of systematic and unsystematic risk. Then is:
σ2Total = σ2systematic + σ2unsystematic
Risk is commonly represented by the greek letter 'sigma' squared, and it is measured via a measurement of variability known as a variance. In portfolio management theory, an investor is only rewarded for undertaking an individual asset's systematic risk.
In other words, an investment's expected risk premium is exclusively driven by systematic/market risk.
Capital Markets Line (CML)
The CML is a theoretical line tangent to the efficient/portfolio frontier. The CML represents the new risk-return portfolio combinations for a given efficient frontier once risk-free assets are made available to investors (such as government bills or bonds).
The CML plots the relationship between a portfolio's standard deviation (unsystematic risk) and its expected return, where the following conditions hold:
E( rp ) = rf + wm [ E( rm ) - rf ]
σp = wm σm
- E( rp ) stands for portfolio expected return
- rf stands for risk-free return on government bills or bonds
- wm stands for portfolio weight on a market portfolio m
- σp stands for portfolio standard deviation
- σm stands for market standard deviation
A portfolio is efficient if there is no other portfolio that has the following:
- A higher expected return for an equal or lower variance or
- An equal expected return for a lower variance
Only portfolios on the CML are said to be efficient. An additional key assumption for the CML is that all investors are risk-averse. Still, it allows some to be less risk-averse by moving towards a portfolio with more market exposure.
The CML tells us that investors will choose to hold efficient portfolios. Furthermore, the CML also helps us graphically determine the location of the theoretical market portfolio.
Capital Market Line Example
An investor is willing to take on a portfolio standard deviation of 30% and combine that with a mix of the market portfolio and riskless borrowing (ex., buying using margin at an interest rate equal to the risk-free rate) or lending (investing in government bonds).
What is the expected return the investor could achieve under these conditions, given a risk-free rate of 3%, a market standard deviation of 15%, and a market portfolio expected return of 10%?
To find a combination of the market portfolio and the riskless asset;
σp = wm σm
0.3 = wm (0.15)
wm = 0.30 / 0.15 = 2
Therefore, the investor should allocate 200% in the market portfolio and borrow -100% ((1-2)). By doing this, an investor would achieve an expected return of 17% { E( rp ) = (2 * 0.1) + (-1 * 0.03) = 0.17 }
Using the Security Market Line
As previously stated, the SML formula states the following:
E( ri ) = rf + ßi [ E( rm ) - rf ] (Equation 1)
From the above equation, we can quickly determine the 3 main functions of the SML:
- Plots expected return and beta
- Shows the relationship between an individual stock or portfolio's expected return and systematic risk
- Potentially useful for pricing individual assets
Based on equation (1), we can plot all combinations of expected returns and beta coefficients, with beta on the x-axis and expected returns on the y-axis. By doing such, we can produce the following graphical representation of the security market line (SML) formula:
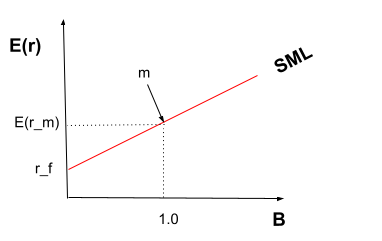
Where,
- E( r ) is the individual asset i's expected return
- r_f is the risk-free rate of return
- E(r_m) is the market portfolio m's expected return
- B is defined as a stock's beta or systematic risk
- m is the market portfolio, which holds a beta of 1
The SML shows how the expected return of stocks or portfolios depends on beta. Under CAPM assumptions, the expected rates of return for all stocks or portfolios lie on the SML.
An important implication from the graph above is that all stocks and portfolios in the SML line are assumed to be correctly priced. This assumption is explicitly derived from the CAPM.
Furthermore, solving for the slope of the SML yields the following:
Slope = Change in Y-axis / Change
= [ E( rm ) - rf ] / [ ßm- 0 ]
= E( rm ) - rf
In other words, the slope of the SML is equal to the market risk premium.
Since the hypothetical market portfolio carries a beta of 1, it is easy to tell if a given stock is more or less volatile than the overall market.
For instance, cyclical stocks are more likely to be located to the right of the market portfolio 'm', with a beta greater than 1.
On the other hand, defensive stocks would carry a beta of less than 1.
Understanding a stock's beta
As mentioned, idiosyncratic or company-specific risks can be diversified away. However, the contribution of a stock to the risk of a well-diversified portfolio depends on how much the stock co-varies with the market portfolio.
In other words, beta is the slope of the regression line of individual stock returns on market portfolio returns. Beta measures the sensitivity of a stock's returns relative to the fluctuations in market portfolio returns.
The formula for a stock's beta is as follows:
ßi = Cov( ri , rm ) / σ2m
The beta of the market portfolio, such as the S&P 500, is always 1:
ßm = Cov( rm , rm ) / σ3m
= σ3m / σ3m = 1
Since the average beta of all stocks (i.e., market portfolio) is 1, stocks with a beta greater than 1 are more sensitive to market fluctuation. Meanwhile, stocks with a beta of less than 1 are said to be more insensitive to market fluctuations.
For example, according to the GICS commercial classification system, there are 11 sectors in the US: basic materials and processing, consumer discretionary, consumer staples, energy, financial services, health care, industrial and producer durables, real estate, technology, telecommunications, and utilities.
From the above sectors, basic materials and processing, consumer discretionary, energy, financial services, industrial and producer durables, and technology are all composed of cyclical firms that typically carry a beta greater than 1.
On the other hand, industries such as healthcare, consumer staples, utilities, and communications, are all non-cyclical sectors commonly made up of firms with a beta of less than
Furthermore, a risk-free asset, such as a US government bond, has a zero beta because its expected return is the actual return you'll get (i.e., no variance/constant expected returns).
A stock with high volatility (return variance) but a low beta is said to be not risky given the premise that volatility caused by factors unrelated to beta is known to be company-specific; these risks can be avoided via portfolio diversification.
security market line (SML) assumptions
Some of the assumptions include:
- Only systematic risk earns a risk premium: This assumption comes from traditional investment theory. I.e., Beta drives expected returns, not company risk
- The expected rates of return for all stocks or portfolios lie on the SML: A result of this assumption is that all risky investments are part of the market portfolio.
- All stocks and portfolios in the SML line are assumed to be correctly priced: Therefore, a stock is mispriced if it is not located in the SML line. The CAPM formula helps determine the price at which the market will be in equilibrium.
- The market portfolio used in the analysis contains all risky asset classes worldwide, each with their respective proportions: This assumption helps achieve wide diversification.
- SML relies on CAPM assumptions: A big assumption is that the market is always efficient and hence correctly prices assets. Despite the flaws in the CAPM assumption, almost 80% of firms use the CAPM formula to estimate the cost of capital.
Security Market Line (SML) Examples
Using the SML to find required rates of return.
Example 1
Assume the expected return on the shares of company ZZZ has a covariance with the market return of 0.085. Furthermore, the expected return on the market portfolio (say, the S&P 5000) is 10%, and the variance of the market portfolio returns is 0.05.
Assuming the risk-free rate on government bonds is 3%, and shares of company ZZZ are correctly priced ( i.e., lies on the SML), what is ZZZ's expected rate of return?
Answer:
Step 1: Calculate the stock's beta
ßzzz = Cov( ri , rm ) / σ2m= 0.085 / 0.05 = 1.7
Step 2: Calculate the expected return on ZZZ
E( ri ) = rf + ßi [ E( rm ) - rf ] = 0.03 + 1.7 [ 0.1 - 0.03 ] = 0.149 = 14.9%
Tip: notice how the expected return on a stock is inversely related to its stock price
Pzzz = Div1 / (r - g)
where 'r' stands for the required rate of return on equity (i.e., cost of equity)
Example 2
Assume stock ZZZ has a beta coefficient of 0.8. ZZZ's expected stable dividend growth rate is 8%. The company is expected to pay a dividend of $4 one year from now.
The risk-free rate on US government bonds currently yields 3%, while the market portfolio, proxied by the S&P 500, is expected to return 10% annually.
Given the above information, what is ZZZ's expected return investors require to invest in the company? What should the stock be worth today?
Answer:
Step 1: Use the CAPM formula to find the required return on equity, "rzzz":
E( rzzz ) = 0.03 + 0.8 ( 0.1 - 0.03 ) = 0.086 = 8.6%.
Hence, ZZZ's cost of equity is 8.6%
Step 2: By using the Gordon Growth Model,
P0 = Div0 ( 1 + g ) / ( rzzz - g ) = Div1 / ( rzzz - g ) = 40.086 - 0.08 = 666.7
Hence, based on ZZZ's required rate of return, dividend growth rate, and divided payment one year from now, ZZZ should be worth $666.7 today.
SML and Security Pricing
The SML is built in such a way that it helps us identify if a given security is overpriced or underpriced.
The following rules are:
1. If a stock is located below the SML, the security is assumed to be overvalued since its expected return is too low relative to its beta coefficient
2. If a stock is located above the SML, the security is assumed to be undervalued since its expected return is too high relative to its beta coefficient
A stock's price and required rate of return satisfy the following inverse relationship:
↑P0 = Div1 / ( ↓r - g ), ↓P0 = Div1 / ( ↑r - g )
Example 1:
Assume you are an analyst investigating the stock price of company ZZZ and company YYY. ZZZ has a beta coefficient of 0.8, while company YYY has a beta coefficient of 1.2. Furthermore, ZZZ carries an expected return of 12.5%, whereas YYY's expected return is 8%.
Moreover, the risk-free rate is 3%, and the expected return on the market portfolio is 10% annually ( implying that the market risk premium is 7%).
1. What should the equilibrium required rate of return be for each stock according to the SML?
ZZZ's required rate of return should be 0.03 + 0.8 ( 0.07 ), or 8.6%
YYY's required rate of return should be 11.4%
2. Which stock is above, and which is below the SML?
Since ZZZ's current required rate of return of 12.5% is more than what the SML suggests (8.6%), ZZZ's stock is undervalued.
A similar analysis on YYY indicates that its current required rate of return of 8% is lower than the SML suggests (11.4%). As a result, YYY's stock is overvalued.
3. ZZZ's current market price is 117.6$. You believe ZZZ has an estimated dividend growth rate of 4% and will pay a $10 dividend 1 year from now. If the analyst were to use the correct discount rate to value ZZZ, what should the correct price for the stock be?
ZZZ's market price using incorrect discount rate: 10 / ( 0.125 - 0.04 ) = $117.6
ZZZ's price using the correct discount rate: 10 / ( 0.086 - 0.04 ) = $217.4
Potential capital gains per share: $ 99.8, or an implied upside potential of 84.86%.
Hence, on a fundamental basis, the market is inefficient in pricing ZZZ. This result violates the semi-strong form of the efficient market hypothesis since we are essentially using accounting and economic data to find undervalued stocks and therefore beat the market.
Example 2:
Assume the risk-free rate is 3% and the expected return on the market portfolio is 10%. Company ZZZ pays zero dividends and currently trades at $15. If ZZZ has a beta of 0.8, at what price should ZZZ trade by year-end?
Answer:
ZZZ has an expected return of 3.56% ( 0.03 + 0.08 ( 0.07 ) ).
Hence,
p0 = div1 / ( r - g ) (Equation 2)
By substituting values and rearranging equation (2), we get:
r = dividend yield + capital gains yield/price appreciation
r = ( div1 / P ) + g
0.0356 = { 0 / 15 } + { [ E( P1 ) - P0 ] / P0 }
0.0356 = { E( P1 ) / P0 } - { P0 / P0 }
0.0356 + 1 = E( P1 ) / 15
E( P1 )=( 0.0356 + 1 ) * 15 = $15.534
The price increase is driven entirely by capital appreciation yield since ZZZ's dividend yield is zero.
SML Advantages and Limitations
As previously noted, the mathematical representation of the SML is nothing other than the CAPM formula. Therefore, even though the latter formula is a forward-looking expected return model, no guaranteed expected return equals actual return.
Other factors, such as unexpected news, may positively or negatively affect a company's stock price, depending on whether such an event diverges from expectations or consensus positively or negatively.
Moreover, the SML calls for a theoretical market portfolio that includes all risky assets worldwide, ranging from securities (equities and fixed income) to contracts (options, futures, forwards, swaps, insurance, etc.) to commodities, real assets, and currencies.
Having a market portfolio of this size helps capture the idea of perfect diversification.
In practice, however, such a portfolio is impossible to replicate. Under this constraint, analysts and investors must rely on proxies such as the S&P 500 in the US. However, these indexes need to be more accurate compared to the theoretical concept implied by the SML.
Additional caveats when dealing with expected return calculations involve estimating market risk premiums, beta coefficients, and risk-free rates.
An analyst may use historical (average) or forward-looking data for risk premium calculations or use 10-year or 2-year bonds for risk-free rate calculations. In practice, however, it all depends on the assumed time horizon of the investment/s.
Furthermore, estimating beta may be tricky. For example, you could regress beta based on 2 years of past weekly data and 5 years of past monthly data. Betas can change depending on the market proxy you use or whether you are using a raw beta, industry beta, or risk-adjusted beta.
As a final note, even though the SML is useful in finding the required equity rates of return and identifying mispriced securities, bear in mind that the CAPM assumes that assets are priced correctly.
Nonetheless, empirical evidence suggests a semi-strong form of market efficiency is the rule rather than the exception. In other words, markets are not always efficient as CAPM assumes.
Despite the above limitations, CAPM is still the most widely used framework for estimating the cost of equity, evaluating portfolio manager performance, risk budgeting, making investment recommendations, or even for portfolio allocation considerations by, say, pension funds.
Deriving security market line (SML) from capital market line (CML)
The CML helps complement SML analysis in such a way that it helps investors compare the difference between a stock or portfolio's idiosyncratic risk, systematic risk, and expected returns.
For example, Investor A has two investment options:
- Option A: Invest in the market portfolio, which carries an expected return of 10% and a standard deviation of 18%
- Option B: Invest in ZZZ's stock alone, which carries a covariance with market returns of 0.02 and a standard deviation of 45%
Assuming the risk-free rate is 3%, then the following is true:
1. The total risk of both options is 64% (18% plus 45%)
2. ZZZ's systematic risk/beta is 0.61 (0.02 divided by 18% to the power of 2). This means that ZZZ is inherently less risky than the market
- Since ZZZ stock is assumed to be part of the market portfolio, we ignore idiosyncratic risk and focus on beta. Since ZZZ's beta is less than the market beta of 1, adding ZZZ to your overall portfolio will result in gains from diversification.
3. ZZZ's expected return is 7.27% ( 0.03 + 0.61( 0.1 - 0.03 ) )
- From a CML perspective, the market portfolio dominates ZZZ's stock (i.e., is more efficient in terms of risk-adjusted returns) since the market portfolio offers a higher expected return (10% > 7.27%) for a lower standard deviation (18% < 45%).
- The above analysis means that investing in ZZZ alone is considered inefficient.
Even though traditional investment theory entails that higher risk leads to higher returns, this is not the case with ZZZ since investors reward only systematic risk through a risk premium.
Since ZZZ's systematic risk, its beta, is less than the market's portfolio beta, the market portfolio has a higher systematic risk and hence a higher expected return.
Security Market Line (SML) FAQs
Total risk is equal to market risk plus individual asset’s risk. In other words, total risk is systematic risk + unsystematic/idiosyncratic risk, or market standard deviation plus individual asset’s standard deviation.
- The SML plots expected returns vs. beta, whereas the CML plots expected returns vs. standard deviation.
- The SML shows the relationship between a stock or portfolio’s systematic risk and expected return, whereas the CML shows what portfolios investors will choose to hold (i.e., efficient portfolios)
- The SML helps price individual stocks, whereas the CML does not
- The SML does not help determine the location of the market portfolio, whereas the CML does

Researched and authored by Christian Algaraña
Free Resources
To continue learning and advancing your career, check out these additional helpful WSO resources:

or Want to Sign up with your social account?