Please help: Which S&U table is right in Cash Free / Debt Free Deal?
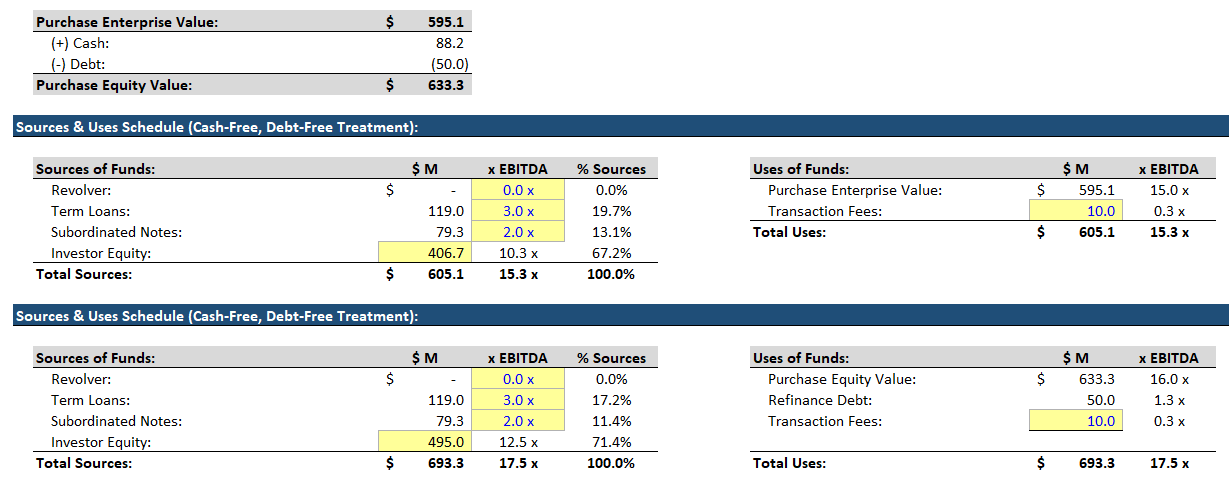
Hi guys, assuming a cash-free, debt-free transaction, can you please explain which source and use table below is correct? I would assume the two should be identical but you can see that the investor equity required between the two is different.
If in the second table, if cash of $88.2M is added as a source, it would make the two tables equal. However, my understanding of CF / DF implies that B/S cash is given to the seller pre-transaction and cannot be used in the transaction as a source (i.e., B/S cash at transaction is effectively 0?) Does this mean that in reality when calculating the equity value, the cash should really be zeroed out and not show as 88.2M? Therefore the true equity value is really 545.1 which would therefore flow to seller proceeds accordingly?


-
Thank you! So even though the seller is entitled to the cash on the B/S prior to the transaction, it can still be used as a source in the S&U table?
Because the seller is entitled to the cash is precisely the reason it is included as a source. That cash is a source of funds distributed to the seller (and/or used to pay down existing debt, which is effectively the same thing).
Et aut aspernatur exercitationem necessitatibus eveniet explicabo. Eaque incidunt rem sed. Inventore et non repellendus optio mollitia. Cupiditate sit numquam vel qui sapiente quo.
Debitis omnis sint rerum illo aliquam nam est. Illum ad beatae non non sit qui modi. Minima blanditiis itaque sed optio eum.
See All Comments - 100% Free
WSO depends on everyone being able to pitch in when they know something. Unlock with your email and get bonus: 6 financial modeling lessons free ($199 value)
or Unlock with your social account...