REIT valuation : DCF and NAV for Colony NorthStar merger
Hi Fellow Monkeys,
I made an M&A case study on Colony NorthStar merger. I'm still frustrated because I've not fixed a lot of points and I found the case very interesting. So I would be very happy to have your advise on the topic. It might be a bit long, but I need to enter into some details.
I've tried to compute the DCF and the NAV for each of the 3 companies merging, Colony Capital, NorthStar Asset Management and NorthStar Realty Finance.
I'm not doubtful about the results of my valuation - and not quite sure of the right methodology to adopt.
DCF :
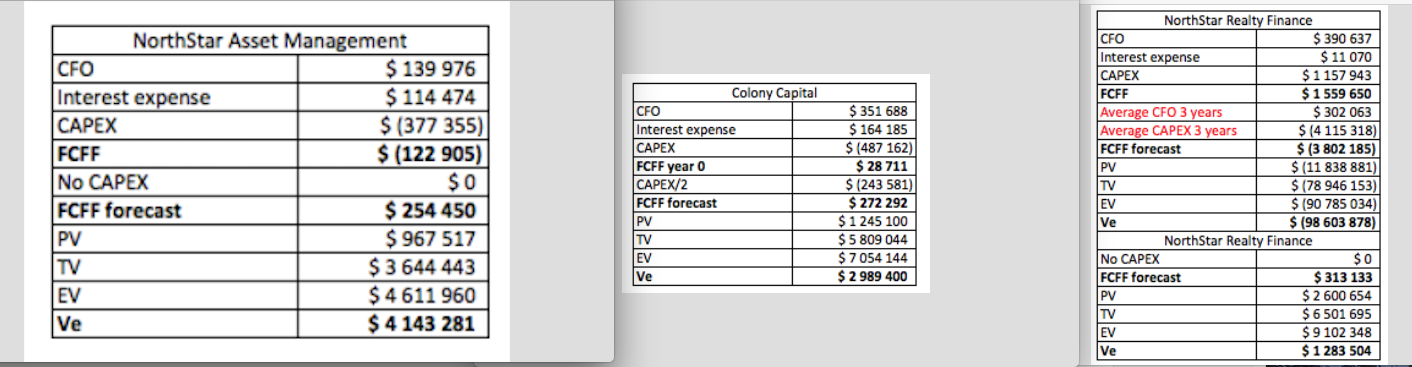
I've chosen to do it starting from FCFF rather than FCFE (feel free to tell me if you think it's not the proper metric).
I've computed FCFF from Cash Flow Statement but with Interest coming from the Income Statement (Interest expenses).
I've used the formula : FCFF = Op. Cash Flow + interest expense - Capex
(basically, interpreted : erwan marginalq ch6MBA)
(I first tried with a FCFE formula from a BIWS pdf, using CF statement, got very high numbers)
cf. DCF.png
The hardest thing for me at the moment, it is to understand how I have to use those formulas with actual 10-K items... Not easy to decide what do you include/exclude.
As the last data available for the 3 companies was 2016 10-Q3, I've used TTM data ('15 Q3 -> '16 Q3).
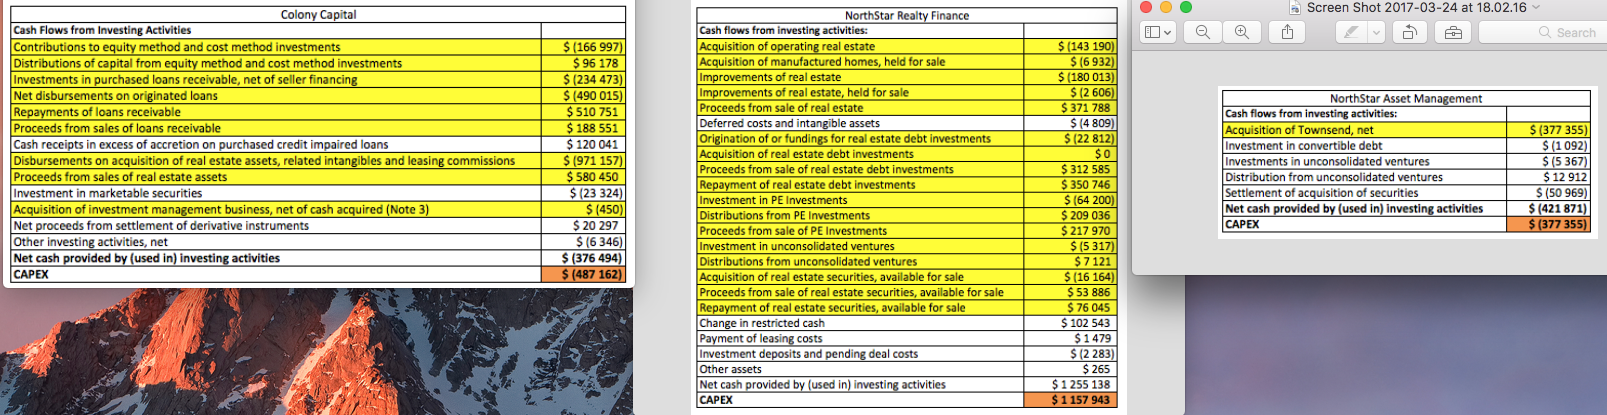
cf. FCFF.png
An other problem is that for NorthStar AM, investing cash flows are anomaly high that year because it acquired a 84% stake in Townsend.
I've decided to use a broad definition of Capex, but again, not sure of the items I should include or not.
Here you can find the items I've selected :
cf. CAPEX.png
That's for the FCFF of the 1st year...
For the FCFF Y2 to Y5, I've removed what I consider normal Capex (i.e. Townsend acquisition for NSAM).
For the terminal value, I've removed all Capex for NSAM, but no growth rate on perpetuity (the rationale : as the growth is mainly fuelled by acquisition, no infinite growth by acquisition). The same for Colony but with half Capex, and for NRF I've tried both methods (because I got negative EV with my chosen Capex)
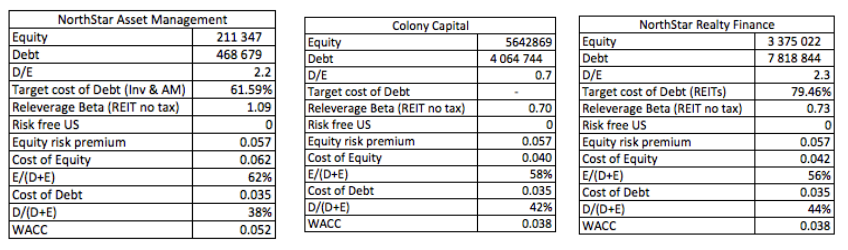
For the WACC, I just used Damodaran data. As I did not have companies beta (after the merger, the data was deleted, and I didn't find any archives).
You can see the results in DCF.png.
NAV :
For the NAV, here is the formula I've settled on :
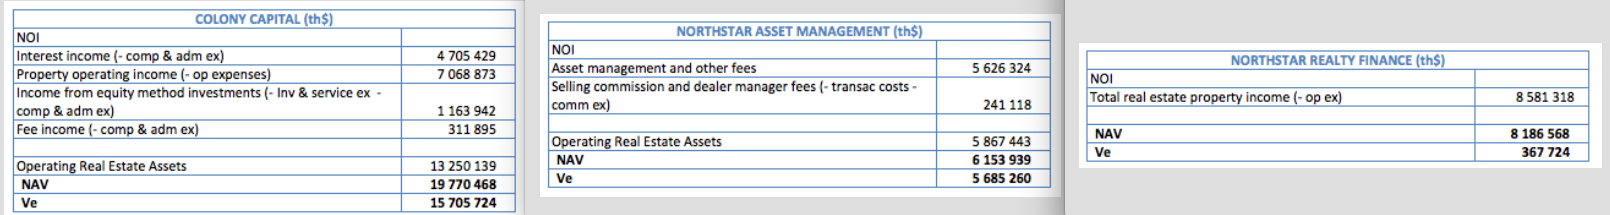
NAV = Operating real estate assets + Non-operating REA + Other assets - Total liabilities
with Operating real estate assets = NOI4/cap rate
> NOI4 because I've used 2016 Q3 data here, so *4 to get an annual approximate.
The problem is NOI and cap rate :
- NOI : they are 3 very different type of REITs, which is here just a fiscal status. NSAM only provide Asset Management services ; NRF is mainly an (income) Equity REIT (but some mortgage also) ; Colony Capital is doing both and also opportunistic investment (so I considered this as a regular income).
- Cap Rate : for direct property revenue, I've used market cap rates from JLL reports (getting a composite cap rate weighted by the income represented by each sector in the revenue in 2015 10-k).
For other activities, I didn't know which one use : for asset management, 20% for Colony (risky); 5% for NSAM (because exclusive contract for 20 years with its ex-parent company NRF, so I considered it less risky).
For debt : 10%, considering Colony's debt origination business is mainly mezzanine (so very rough number here).
cf. NAV.png
For non-operating real estate assets, it was not too hard, given that this is pretty explicit in the 10-q.
However, I find astronomical value...or ridiculously low for NRF.
(market cap before merger : Colony $2.9bn, NSAM $2.9bn, NRF $2.99bn)
Thanks a lot for the discussion !


