Fast Stochastic Indicator
A technical metric that identifies trend reversals by measuring general price trends.


What is the Fast Stochastic Indicator?
The Fast Stochastic Indicator (%K) is a technical metric that identifies trend reversals by measuring general price trends.
This metric was created by George Lane, a securities trader, author, educator, speaker, and technical analyst.
This indicator is based on two parameters:
- The lookback period is the period taken into account for the indicator's computation
- The smoothing parameter, i.e., the number of periods in which the moving average of the indicator is computed
The value of the fast stochastic indicator oscillates between 0 and 100 and is calculated as follows:
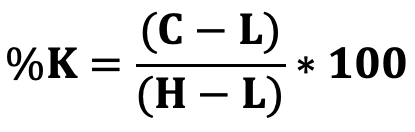
Where,
- C is the Current Price;
- L is the Period Low;
- H is the Period High.
The lookback period for the indicator is generally five or fourteen days. However, it is possible to compute it between five and twenty-one days.
Fast stochastic indicators that take more than twenty-one days into account are ineffective since stock prices are likely to have upward trends.
Key Takeaways
- %K is a technical metric that measures a price's general trend and identifies trend reversals.
- The indicator is based on two parameters: the lookback period (period taken for the oscillator computation) and the smoothing parameter (number of periods for the moving average)
- %K is used to understand the volatility of market trends. It helps investors tell whether a stock is overbought or oversold.
- Using this metric alongside other metrics and indicators is more functional for more precise information.
- The volatility of %K can often generate false and inaccurate results. It is recommended to pair %K with %D (a three-day simple moving average of %K).
- A bear divergence creates a sell signal. The signal can be applied to trend-following strategies, with the trader opening a short position when the signal is given.
- A bull divergence creates a buy signal, meaning that the trader may see a reversal in the price drop and place a buy order.
- The slow stochastic indicator is more likely to give out accurate signals. It is less volatile at the extremes and provides more stability to the signs, helping to overcome the volatility issue of the fast indicator.
How to Interpret the Fast Stochastic Oscillator
The fast stochastic indicator (%K) is used to understand how solid a market trend is regarding price oscillations. Such a metric is beneficial for investors because it helps them generate signals on whether a stock is overbought or oversold.
An asset can be considered oversold if the indicator is under 25-20%. On the other hand, it is considered to be overbought when the %K is over 75-80%. These levels are pretty functional because they can be used as trading strategies. For example, when %K is above 75-80, it might be time to sell the stock, and when it is below 25-20, it could be considered a buy signal.
%K is more functional when used alongside other metrics and indicators. They allow traders to better understand the price movements of equity and help during day-trading activities.
%K is a highly volatile indicator that can generate inaccurate results. However, one can compute and utilize %D, a three-day simple moving average of %K, to overcome this issue. %D moves slower than the fast stochastic indicator and can reinforce a signal.
George Lane's Trading Strategy
George Lane, the creator of the fast stochastic indicator, has suggested following this kind of strategy when using the %K metric.
First, it is recommended to use the oversold and overbought levels as preconditions, meaning that when the metric goes above or below the predetermined levels, the investor must check for any price divergences.
A divergence occurs when the price fluctuates in a different direction compared to the metric. Two kinds of divergences exist:
1. Bear Divergence
This divergence is identified when a sell signal occurs. The first requirement of a bear divergence is when the fast stochastic indicator goes over the 75-80% level. Furthermore, %K has to be over %D. In this case, the asset price increases, and the %K metric falls simultaneously.
This is a sign of a weak up-trend and that the stock price might eventually decrease. Given such conditions, the trader should not buy the asset since this is a sell sign. Instead, placing a sell order (or any other short position) on the equity is suggested.
The bear divergence indicator can be applied to trend-following strategies. The trader then opens a short position when the %K indicator gives the sell signal. This strategy is considered risky as such signals might not always be accurate.
2. Bull Divergence
A bull divergence creates a buy signal. This happens when the stochastic indicator goes below the 25-20% level. In this case, the trader needs to check for two other conditions. Firstly, it is crucial that %K also be under %D. Secondly, it is essential to check whether there is a divergence between %K and the asset's price.
If the stock price continues to fall and %K increases, it is considered to be a reversal in the trend. This is a buy signal, so the trader should place an order to buy the equity. When %K crosses the sell level, the asset should be sold.
Fast Stochastic Indicator Vs. Slow Stochastic Indicator
When putting one against the other, one can see that the fast stochastic indicator is much more volatile than the slow indicator. The fast indicator gives out a lot of signals to the trader, meaning that if this method is used frequently, it results in a significant number of executed trades, increasing transaction costs.
The slow stochastic indicator tends to give out more accurate trading signals. Conversely, the Fast Stochastic Indicator is more likely to generate false signals, leading to unsuccessful trades for the trader.
Lastly, the slow indicator is less likely to oscillate at the extremes, providing more stability to the signals. This counteracts the volatility issue of the fast indicator.
This is given by the slow indicator taking into account a moving average, so its computation is based on a more extensive set of data. The fast indicator, on the other hand, helps find short-term market trends, as it is based on more recent price data.
Stochastic oscillator charting is usually formed of two lines. The first reflects the indicator's real value every session, while the second reflects the three-day simple moving average of the fast stochastic indicator.
These two lines are chosen as they are believed to signal specific trends. In case of an intersection between the lines, there might be a chance for a reversal since this is a sign of significant change in the movement.


or Want to Sign up with your social account?