Average Propensity to Consume (APC)
The ratio of consumption expenditure to the corresponding level of income


What Is the Average Propensity to Consume?
The average propensity to consumer (APC) is the ratio of consumption expenditure to the corresponding level of income. In other words, it shows how much income the consumer consumes.
It is useful for individual consumers who want to track their consumption and savings and economists to track the spending habits of the entire nation.
Both cases are calculated by dividing average consumption by average income.
Every individual either spends or saves their income. In this model, there is no other way in which income can be used. That is:
Y = C + S
where,
- Y is income or disposable income
- C is consumption
- S is savings
The functional relationship between consumption and national income is called a consumption function or the propensity to consume.
C = f (Y)
Read as C is a function of Y.
A consumption function represents the willingness of households to purchase goods and services at a particular income level and during a given period.
It shows the consumption at different levels of income. It is a psychological concept influenced by subjective factors such as consumer preferences, habits, etc.
Key Takeaways
- The average propensity to consume is the consumption expenditure ratio to the corresponding income level.
- APC can never be zero.
- Constant APC only implies that the ratio C/Y is constant.
- APC's magnitude over the long term and its reaction to economic shocks are important factors determining the success of countercyclical policies in the economy.
Calculating the average propensity to consume
It is crucial to understand how disposable income is utilized in an economy. It can be explained by the notion that, while consumption rates determine the APC component of the Gross Domestic Product (GDP), saving rates act as the economy's engine.
The following is the calculation formula:
Average Propensity to Consume = Consumption (C) / Disposable Income (Y)
Graphical representation
It can be represented as any point on the consumption curve, showing the ratio between consumption and income.
C = a + bY
APC = C / Y = (a +bY) / Y = a / Y + b
Here 'a' represents autonomous consumption; it is the minimum level of spending, independent of changes in income.
Consumers do not stop purchasing essential goods and services even when their income is zero. Therefore, the amount spent at zero income is called autonomous consumption.
'bY,' on the other hand, is called induced consumption; it is that level of spending that is affected by changes in income.
Here is a table exemplifying the idea:
| Income (Y) | Consumption (C) | Savings (S) | APC = C/Y |
|---|---|---|---|
| 0 | 40 | -40 | - |
| 100 | 120 | -20 | 120/100 = 1.2 |
| 200 | 200 | 0 | 200/200 = 1 |
| 300 | 280 | 20 | 280/300 = 0.96 |
| 400 | 360 | 40 | 360/400 = 0.9 |
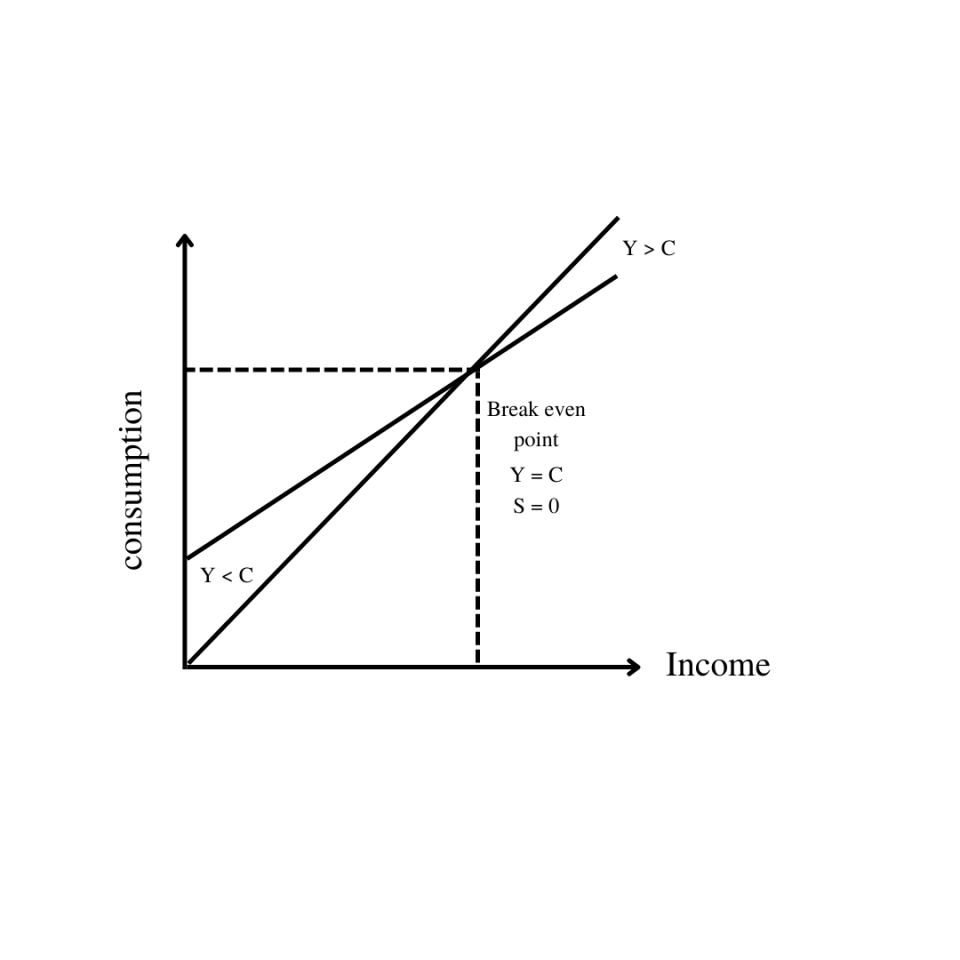
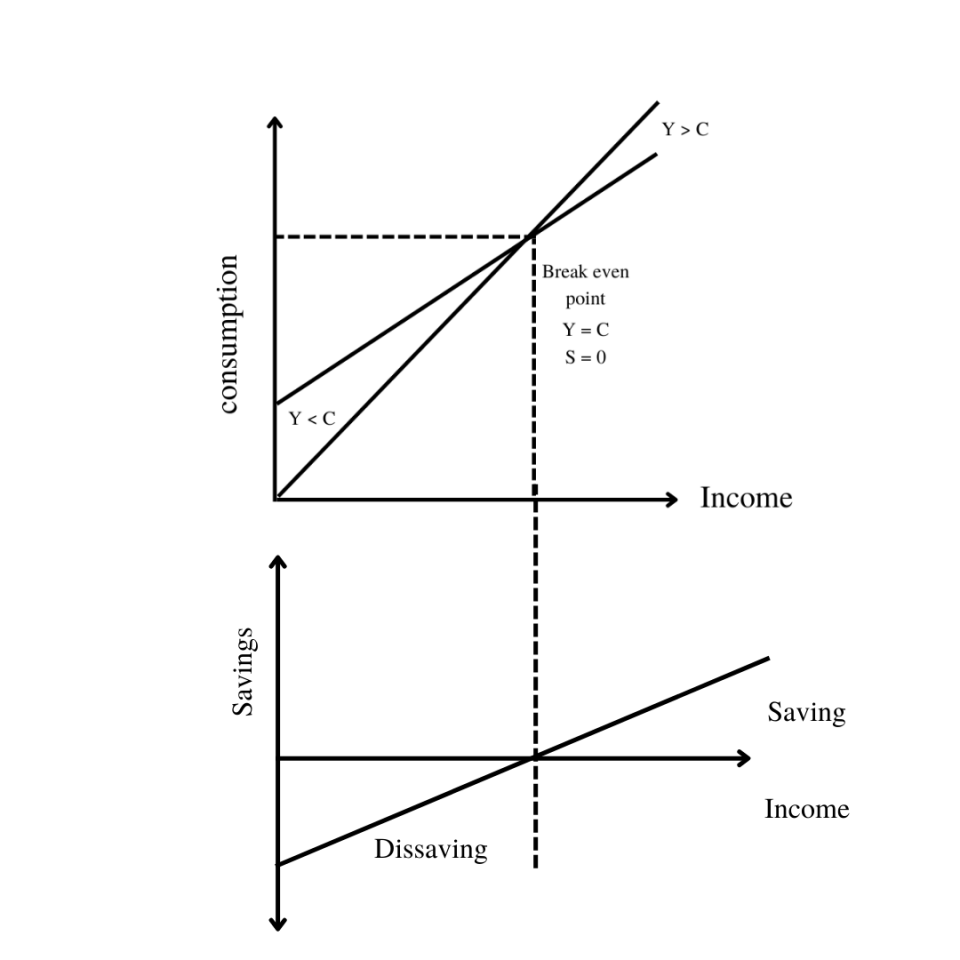
Inferences from the graph
- When Consumption (C) is more significant than income (Y), APC is greater than 1, and savings are negative. This happens because, in addition to spending the total income, the consumer is also spending from past savings or taking out loans to fulfill their needs.
- When C equals Y, APC is 1, and savings is 0. This means an individual is consuming all their income.
- When C is less than Y, APC is less than 1, and the consumer now starts saving.
Points to remember
- It can never be zero because consumers always spend and fulfill their basic needs. Even with no income, consumption can never be zero.
- Constant APC only implies that the ratio C/Y is constant, not that C and Y are constant separately.
- It can never be negative because consumers will always spend the same or marginally more as income rises.
Law of Consumption
The law of consumption states that when income increases, consumption also increases. But this increase in consumption is not to the same (in fact, to a lesser) extent as the increase in income because a part of the income is also saved.
The law is also called the Keynesian law of consumption, named after John Maynard Keynes. He introduced this psychological law of consumption in his book, "The General Theory of Employment, Interest, and Money."
Propositions of the law
- When overall income rises, consumption expenditure will follow suit, though usually less percentage-wise.
- An increase in income is always divided into spending and saving.
- An increase in income will, therefore, lead to an increase in both consumption and savings. When income increases, a reduction in consumption or savings is not generally expected. This is because there is no reason for an individual to cut down on their expenses or be willing to save when earning more.
- The increase or decrease in savings will be more significant when less income is made.
Two principal factors influence the consumption function:
- Subjective factors - These include the psychological characteristics of humans and behavior patterns. They are unlikely to change in a short period.
- Objective factors- These include changes in wage level, changes in policies, distribution of income, fiscal policy, etc. They may undergo rapid changes in a short period.
Marginal Propensity to Consume vs. Average Propensity to Consume
The marginal propensity to consume is defined as the relationship between changes in spending and changes in income. The critical differences between APC and MPC are listed below:
| Comparison | APC | MPC |
|---|---|---|
| Formula | C/Y | ΔC/ΔY |
| Indicates | Consumption per unit level of income | Consumption per unit of additional income |
| Graphical representation | Any point on the consumption curve | The slope of the consumption curve |
| Exception | It can never be zero | Can be zero |
| Example | Suppose, at an income of $300 billion, consumption is $250 billion. APC will then be 250/300, equalling 0.83. | Suppose income increases by $100 billion and consumption increases by $50 billion. Therefore, MPC = 50/100, which is equal to 0.5. |
Relation
- As income rises, the MPC falls, and so does the APC. However, the MPC falls to a greater extent than the APC.
- As income falls, the MPC rises, and so does the APC, but at a slower rate.
- When APC is constant, APC = MPC.
Understanding APC and APS
The average propensity to save, or the saving ratio, is the ratio of total savings to total income. Algebraically denoted as:
APS = S / Y
Where S refers to savings and Y refers to income.
The age distribution of a country's population and behavior concerning future savings plans are two characteristics that may be related to the current population's saving rate.
An individual should use disposable income when calculating either the APC or the APS. Analysts use disposable income to gauge consumer spending, payment capacity, future savings, and the state of a country's economy.
Points to remember
- As mentioned earlier, in this model, any household either saves or consumes their income. Therefore, the sum of APC and APS is always equal to one. As consumption increases, savings decrease, and vice versa. This is true even when APC > 1.
- APS can be negative when savings are negative or when consumption is greater than income. APS can never be one or more than 1.
- This is because if APS equals 1, then APC becomes zero, which, as we saw, due to autonomous spending, is not possible. APS can be 0, meaning the person is not saving and spending all their income.
Average Propensity to Consume Economic Interpretation
Economists use the average propensity to consume to project future economic growth. A high APC means more people are spending more money. This generates demand for goods, services, and, effectively, jobs, fueling economic growth.
On the other hand, a low APC can be destructive for the economy, as people are consuming a very small part of their income and saving the majority.
Low-income households are frequently thought to have a larger average propensity to consume than high-income households.
Low-income households could be compelled to spend all their income on essentials, leaving them with little to save. In contrast, high-income households with more money left over after meeting their basic needs often have a lower average propensity to consume.
The magnitude of the APC over the long term and its reaction to economic shocks are essential factors that determine the success of countercyclical policies in the economy.
Household consumption can maintain a constant level, at least for a short time, during periods of high unemployment, averting a significant recessionary spiral.
Because agents are likely to retain their consumption pattern through bank loans, consumption may remain consistent for some time, even with an unexpected decline in income.
Average Propensity to Consume Example
Assume disposable income is $800 and consumption spending is $600. Calculate the average propensity to consume.
APC = C/Y = 600/800 = 0.75
Or
The individual is consuming 75% of their income.
The GDP (gross domestic product, also the disposable income) of a country is $600 billion. Therefore, the total savings of the economy was $300 billion. Next, calculate the average propensity to consume.
APS = S/Y = 300/600 = 0.5
APC + APS = 1
Average propensity to consume = 0.5
When APC = 0.6, what is APS?
APS = 1 - 0.6 = 0.4
An individual's income is $1000, and he spends $800, so the APC is 0.8. This means that the consumer spends 80% of his income on consuming goods and services.
However, when his income is increased to $1500, his consumption is increased to $1200.
So, the change in income would be $500, and the change in consumption would be $400. Here, the MPC is 0.8. This means that 80% of the additional income is consumed, and the rest is saved.
Conclusion
A key idea in economics, the average propensity to consume (APC) gauges how much of income is spent on consumption. By dividing consumer spending by disposable income, it may be computed.
Economists researching consumer behavior and forecasting future economic growth rely heavily on the APC as a key indicator since it offers insights into both individual spending patterns and larger economic trends.
The average propensity to save (APC), when combined with the marginal propensity to spend (MPC) and the average propensity to save (APS), adds to a thorough picture of how money is used in an economy.
Furthermore, the law of consumption clarifies the connection between income and consumption by emphasizing the tendency for consumption to rise, although somewhat, as income levels rise.
In general, knowing the APC helps legislators create effective economic policies and interventions to manage economic fluctuations and promote sustainable growth.

Free Resources
To continue learning and advancing your career, check out these additional helpful WSO resources:

or Want to Sign up with your social account?