Bollinger Bands®
Technical analysis tool that indicates volatility and potential price movements


What are Bollinger Bands?
Bollinger Bands, invented by John Bollinger in the middle of the 1980s and in 2011, are a technical analysis tool using three bands plotted around a security's price, indicating its volatility and potential price movements.

John Bollinger registered this concept as a trademark, and they can help you identify levels at which the security has been relatively over-purchased or over-sold and identify the volatility in the market. It has three lines:
- Lower band
- Mid-band
- Upper band
The midline is a 20-day moving average by default, but its parameters can be changed per the trader’s preference. The distance between the upper band and lower band is determined using the standard deviation.
Initially, it became known as buying and selling bands. However, later on, John Bollinger developed this idea and popularized it as Bollinger Bands.
These Bands are one of the famous technical evaluation tools wherein three distinct traces are drawn, one underneath and one above the safety rate line.
Its specific duration of the transfer is designated as midline to form an “envelope.” These traces display a band or a volatility variety wherein a selected safety rate transfers up or down.
Volatility is proven based on preferred deviation for a selected safety, denoted utilizing the top and bottom line/band, as the preferred deviation is a degree of volatility.
BB helps determine if the price is relatively high or low. They are pairs of upper and lower bands combined with moving averages. BB is not intended to be used alone. Instead, BB can crosscheck the signals given by other indicators.
These bands can be used in all financial markets, including equities, currencies, commodities, and futures. In addition, it can be employed in various time frames, including hourly, daily, weekly, and monthly.
Bollinger bands can be valuable indicators of market movements; strong trends produce volatility, which can be seen as the Bollinger bands widen and narrow.
-
Bollinger Bands, developed by John Bollinger, include three lines - lower band, mid-band (usually 20-day MA), and upper band, helping identify over-purchased or over-sold levels and market volatility.
-
Bollinger Bands are adaptable across markets and timeframes, aiding traders in spotting potential trading opportunities.
-
Bands' width indicates volatility changes; wider bands during strong trends suggest higher volatility and trend direction.
-
Bollinger Bands guide trading decisions, e.g., prices above upper band suggest overbought conditions, below lower band suggest oversold, influencing short or long positions.
How do you use Bollinger Bands to spot a trading opportunity?
BB can help determine whether the stock’s price is high or low, which can help you identify whether to go long or short. For example, selling pressure increases when the price is above the upper BB, and traders can use this opportunity to short the stock.
- If the price is in a strong uptrend, it will usually touch or move along the upper band while the impulse wave rises. If not, it indicates that the uptrend may be losing momentum.
- A narrower band during periods of low volatility and volume contraction increases the likelihood that the price will move significantly in either direction. This allows you to initiate trend movements.
- Watch out for false moves in the opposite direction that reverses before the correct trend starts.
- Abnormally large separation of the bands can increase volatility and end an existing trend.
- The price tends to bounce within the band envelope, touching one band and then moving to another. These fluctuations can be used to identify potential profit targets.
For example, if the price bounces off the lower band and crosses the moving average, the upper band becomes your profit target.
- The price may exceed or hug the band turnover during strong trends for longer. If you deviate from the Momentum Oscillator, we recommend that you do some additional research to determine if the additional gain is appropriate.
- If the price breaks out of the band, we can expect a continuation of the strong trend. However, if the price bounces back inside the band quickly, the suggested strength will be negated.
Rules to keep in mind while using Bollinger Bands
Bollinger bands are primarily used to determine where overbought or oversold levels exist. Sell when the price touches the upper band and buy when the price touches the lower band. BB is a definition of highs and lows.
By definition, the price is higher in the upper and lower in the lower bands. Using this relative definition, you can compare price movements with indicator movements and make rigorous buying and selling decisions.
Suitable indicators can be derived from momentum, volume, sentiment, open interest, cross-market data, etc. When multiple indicators are used, the indicators must not be directly related to each other.
For example, a momentum indicator like RSI may complement a volume indicator well, but two momentum indicators might not produce a meaningful and unique result.
- These bands can be used in pattern recognition to clarify price patterns such as ‘M’ highs and ‘W’ lows, momentum shifts, etc. 20 periods is a default parameter for calculating the moving average and standard deviation.
- The standard deviations of the bandwidth are the default values, which can be further changed based on personal preferences. Actual parameters required for specific markets/tasks may vary.
- The mean value used as the Bollinger band is not optimal for crossover. Rather, medium-term trends should be accounted for.
How to use Bollinger Bands Double Bottom strategies?
A double-bottom setup is a common BB strategy. The first bottom of this formation is characterized by a sharp fall in price with massive volume and a strong price pullback closing outside the lower BB. These types of moves usually result in “automatic rallies.”
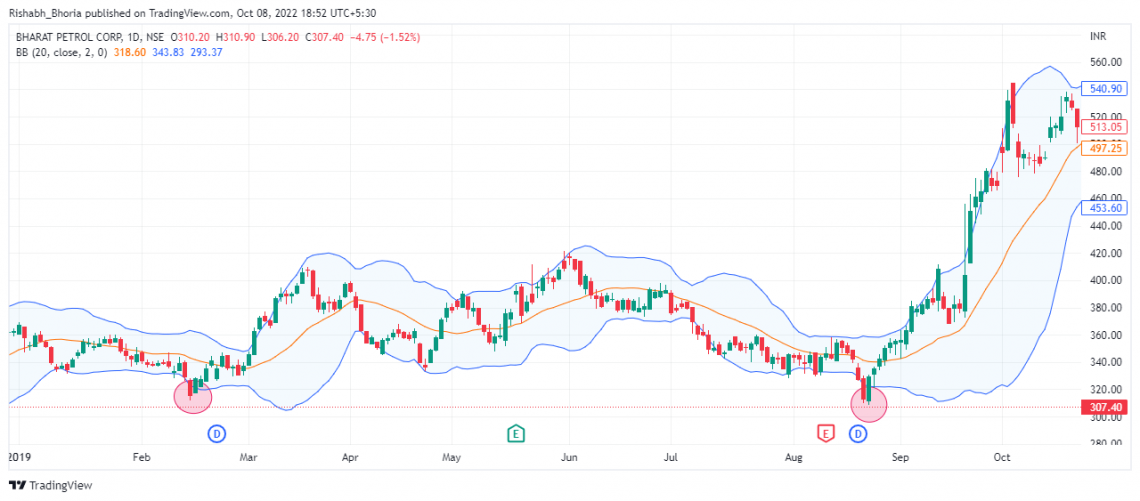
It then momentarily rebounds toward the middle band. Only to descend again, but with a lower volume, joining the lower band. The apex of this rally usually acts as the first resistance level in the base-building process before the stock price rises.
This pattern indicates that the downward pressure has eased. More buyers are coming into the market. Often the next price move is a sharp rise from the second low.
Ensure the candle has closed inside the band at the second bottom before taking an entry and the volume has also dropped.
Those who want to go long can target the middle or upper band. The first swing low crosses the lower BB. A break below Bollinger’s center line could be a confirmation signal. However, a crossover below the Bollinger center line is not always a good confirmation signal.
Especially when the BB is narrow, don’t rely on center-line crosses. If it has made a double-bottom on a more oversized time frame, it has much more reliability for a successful rally from the bottom.
Reversal Strategy
When a stock price goes outside the upper or lower Bollinger band, it is said to be “breaking the band.” Band breaks occur during periods of extreme volatility and are the strongest signal of an imminent trend reversal by BB.
In a normal data pattern, two standard deviations make up about 95% of all data, so using this formula, the market rate should cross the band about 5% of the time.
When the price hits the upper band, the stock trades at a relatively high price and is considered overbought. You can try shortening the stock in hopes that the price will fall toward the central moving average line.
You can also exit your existing long positions near the upper band. Traders use the term “overbought” when the stock price breaks the buy band and “oversold” when it breaks the sell band. Both are perceived as market reversal signals.
Bollinger Band Squeeze Strategy
The BB squeeze is a concept that most traders use to select breakout trades. When volatility drops, so does BB, which could be related to the concept of ‘the calm before the storm”. Conversely, breakouts in any direction can cause big moves.
A BB squeeze occurs when the price gives an aggressive move and then starts to move sideways in a tight consolidation. This trading strategy helps determine which stocks are consolidating with reduced volatility.
Traders can visually identify when a stock price is corrected as the upper and lower bands hold. Volumes usually drop during this time as big players either accumulate or distribute the stock.
Before entering any stock, traders should look at whether a stock is in overbought or oversold areas to get an idea of whether a stock will give a breakout or breakdown. They can thus take short or long positions accordingly.
Traders should always enter after the squeeze and not during the squeeze because it’s hard to predict when the stocks will give a breakout or breakdown.
If the squeeze is more significant and the stock is also in oversold levels, chances are high that the stock will give a more significant breakout, and if the volume has also increased, the stock might sustain its breakout.
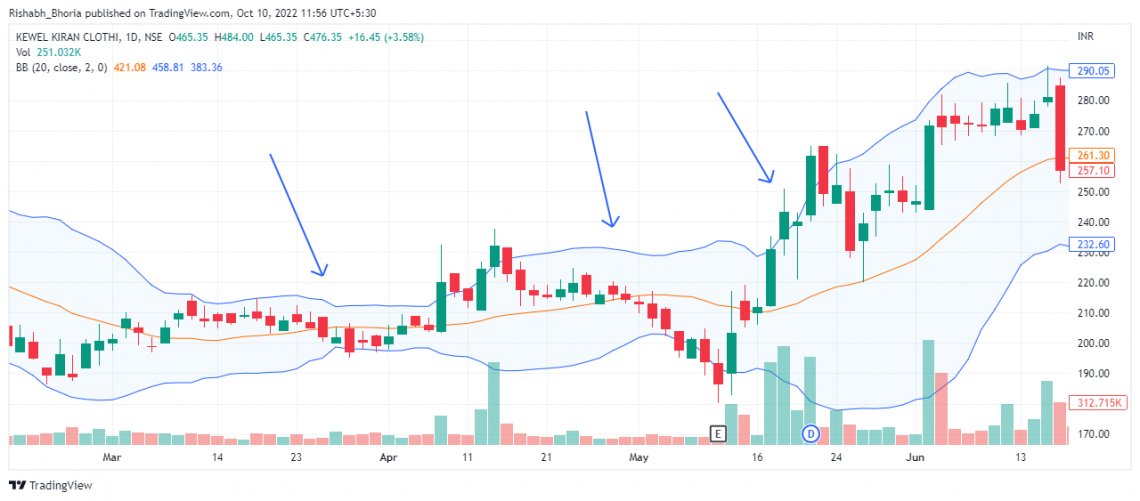
W-Bottoms
W-Bottoms and M-Tops are part of the work of Arthur Merrill, who identified 16 patterns in the basic W-pattern and M-pattern, respectively. BB uses the W pattern to identify a W bottom when the stock’s momentum shifts and prices fall below the lower BB.

The stock price then recovers near the 20-day simple moving average. Third, the price falls to a low but stays above the lower BB this time. Ultimately, the price should rise and see a positive breakout above the previous high of the W pattern.
The price then pulls back to the middle band or above, creating new lows that hold the lower band. Once the price crosses the initial pullback high, a W bottom will appear, as shown in the image above, indicating that the price will likely rise to a new high.
Traders can keep a stop loss at W bottom with a risk/reward ratio of 1:2, with a take profit of mid-band or upper band.
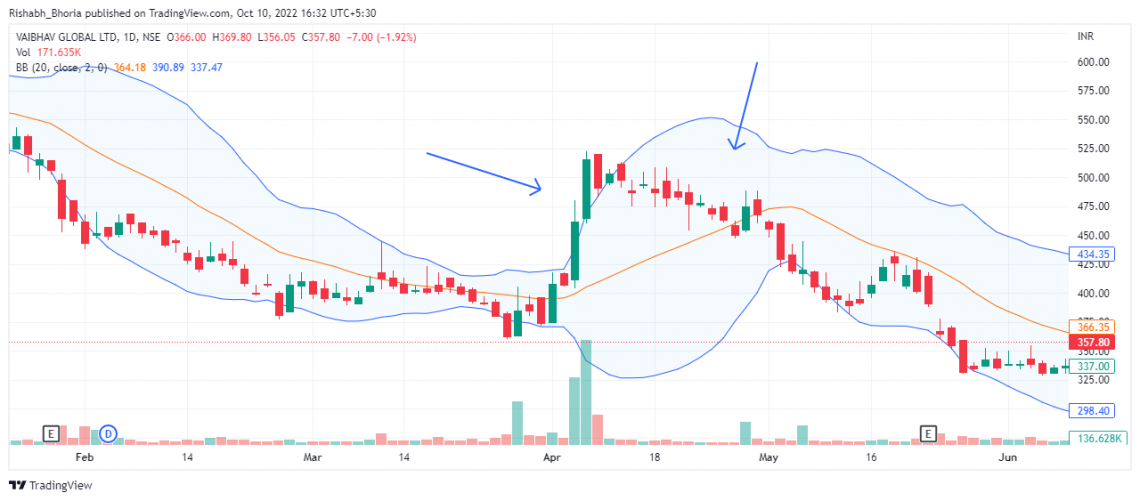
M-Tops
M-Top looks similar to the Double Top chart patterns. M-top occurs when the second high is near or above the upper band. The second high can be a little higher or a little lower than the first high depending upon the aggression of the move.
But the price then pulls back to the middle band or below, creating a new price high but cannot sustain above the upper band and starts to come down with increased volume.
The primary distinction is that the heights of the peaks don’t have to coincide; they might be higher or lower. When employing this technique, you want to watch for reactions resulting in peaks on the top band with an M shape.
John Bollinger suggests looking for the signs of weakness when a stock is making a new high to confirm whether it will be sustainable. He follows three steps to find a weakness in the second high.
- First, the stock makes an aggressive high above the upper band with good volumes, then returns to the mid or lower band.
- Stock makes a reaction high which takes its price closer to the first high or just a little lower than the first high. This is a warning that the stock cannot make a new high with its waning momentum.
- The stock then gives a pullback toward the mid-band or lower band, and final confirmation is accompanied by a break in support or lower Bollinger band with an increase in volume.
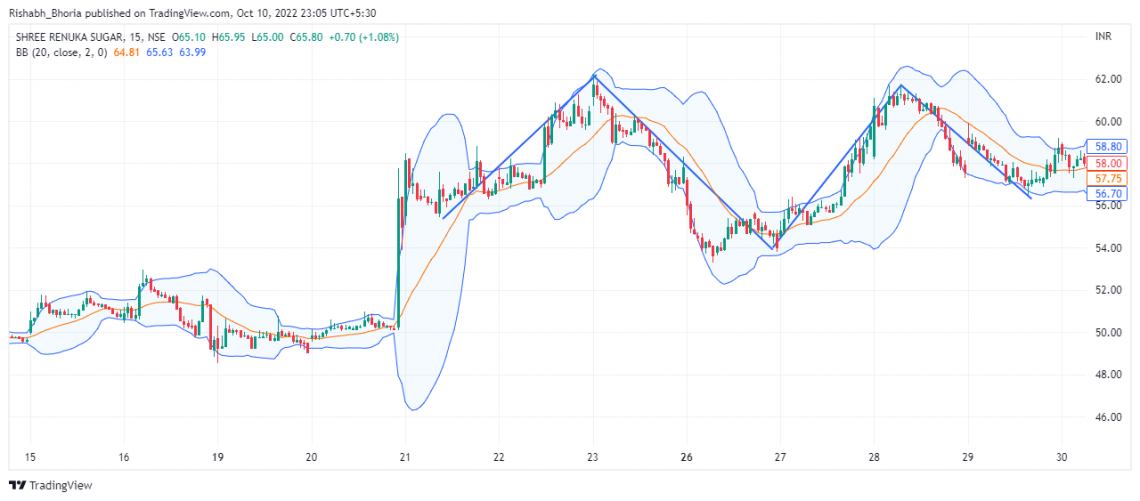
Walking the Bands
A movement to the upper band indicates the strength, and a sharp movement to the lower band indicates weakness. The price can “cross the bands” with many touches during a strong uptrend or downtrend.
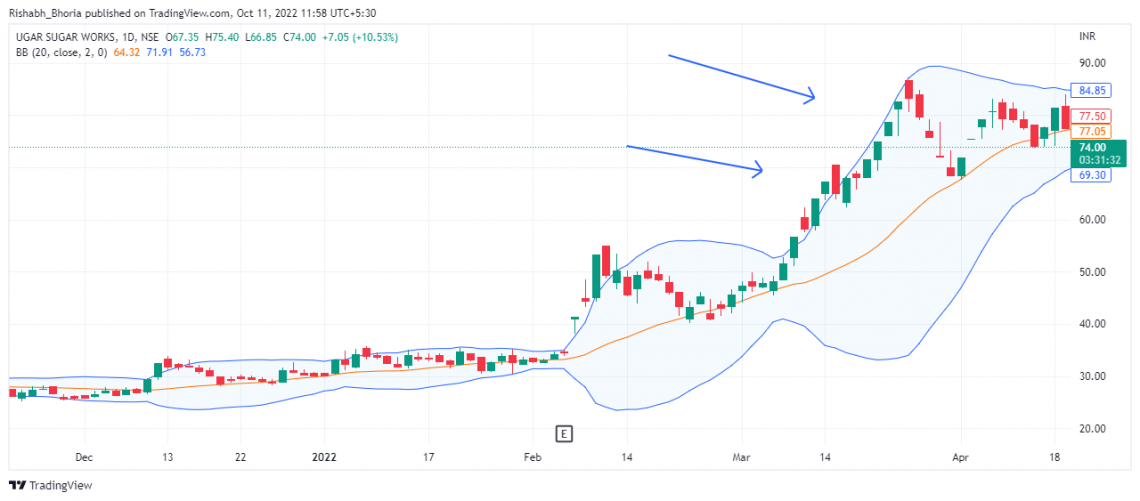
Relatively strong price action is needed to break the upper and lower bands. A price movement is associated with one of the bands called Walking the Bands.
When prices exhibit this phenomenon, we know the trend is very strong, as shown in the image above. Occasionally, the price will return to the 20-period moving average line but still stay above the middle of the Bollinger Bands.
Smart traders study indicator behavior in uptrends, downtrends, sideways, and random market conditions and use this information to make trading decisions.
The opposite is true when walking the lower band. In this case, it’s important to check other indicators, like RSI or stochastic, to see when a buy or sell opportunity occurs if the stock repeatedly bounces out of one of the bands.
When the stock is making aggressive moves in either direction, you can use this opportunity to go long or short.
For example, when the stock is weak, you can go short below the 20-period moving average with a price target of or below the lower band with a stop loss of the the20-period moving average.
In an opposite situation, you can go long when the stock is weak with a price target of or above the upper BB with a stop loss of a 20-period moving average.
Bollinger Band calculations
BB is twice the standard deviation of the 20-day Simple Moving Average, so they are easy to calculate. So, suppose we calculate a 20-day simple moving average. In that case, the upper band will become equal to two times the standard deviation added with a 20-day simple moving average.
Upper band = 20-day SMA + (20-day standard deviation x 2)
Lower band = 20-day SMA – (20-day standard deviation x 2)
Over the same period, the bottom band will be minus two times the standard deviation.
Using standard deviation as a determining variable serves as an indicator of volatility when calculating BB. Bollinger Bands are traditionally calculated from a simple 20-day moving average.
An exponential moving average can also be used as a second choice. The calculation of the period of the moving average, or even the standard deviation multiplier away from the moving average, uses the band calculation and cannot be changed.
It is, by default, recommended to increase the multiplier to 2.5 times the standard deviation when using the 50-day moving average and decrease it to 1.5 times the standard deviation when using the 10-day moving average.


or Want to Sign up with your social account?