Comps – Comparable Trading Multiples
A comparable trading multiple is a relative valuation used to assess a company’s worth.


What Are Comparable Trading Multiples?
A comparable trading multiple is a relative valuation used to assess a company’s worth. The valuation process involves finding a collection of peer companies and deriving multiples based on their financials and market values.
The underlying concept is that the market has accurately priced the collection of peer companies based on which we can determine whether a target company is undervalued or overvalued relative to its peers.
Relative valuation differs from intrinsic valuation in that it derives value through comparing similar businesses. With an intrinsic valuation, the goal is to project a company’s future cash flows and discount them back to their present value.
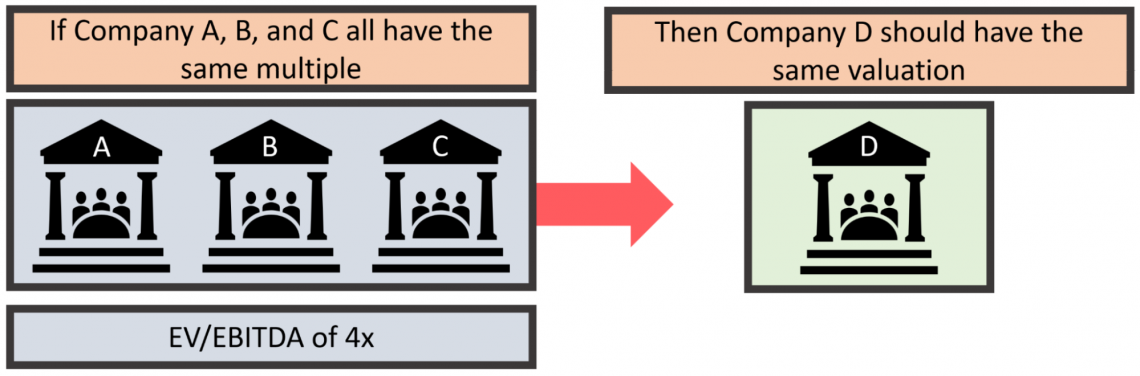
In the above example, we look at a very simple form of relative valuation. Companies A, B, and C all have an EV/EBITDA multiple of 4x. By utilizing this industry multiple, we assume that Company D should have the same multiple.
If Company D is trading above this multiple, we may assume that it is currently overvalued. Likewise, if Company D is trading below this multiple, we may assume that it is currently undervalued.
Industry multiples play an essential role in finance.
- 85% of equity research reports are based upon comparable trading multiples.
- Over 50% of acquisition valuations are based upon comparable trading multiples.
Often the goal is to find companies undervalued relative to their peers. The concept is that an undervalued company will eventually be recognized by the overall financial market and will trade at a multiple similar to its peers one day. This investment philosophy is based on buying low and selling high.
Other times the goal may be to derive the most accurate valuation for an acquisition. Acquirers desire to pay a fair price for a target company and will utilize both relative valuation and intrinsic valuation in tandem.
- A comparable trading multiple is a relative valuation used to assess a company’s worth.
- To create comparable trading multiples, start by identifying similar companies with common traits like industry, capital structure, market size, products, location, and customer base.
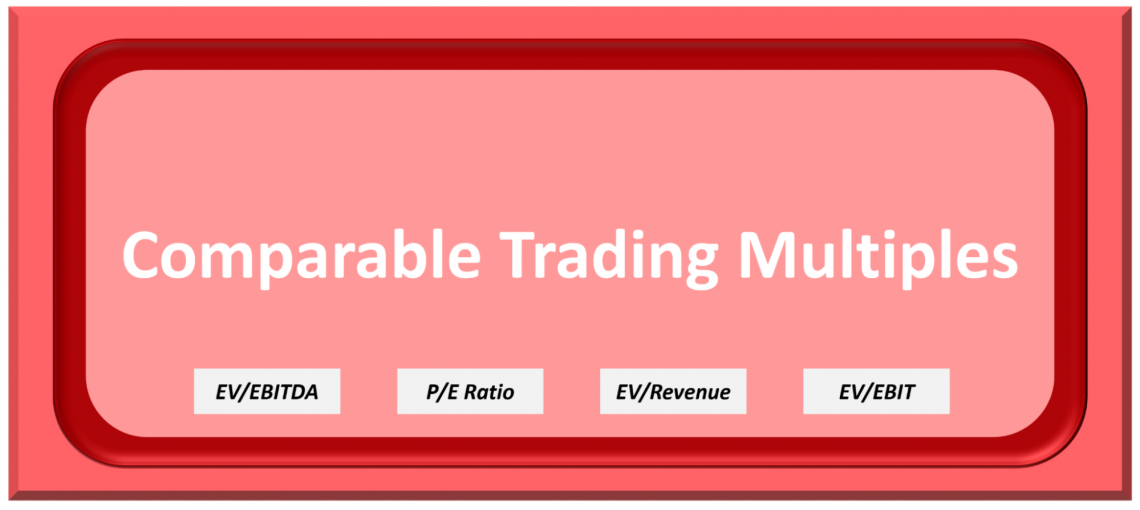
- The main comparable trading multiples used in comparable company analysis are EV/EBITDA, EV/EBIT, EV/Revenue, and the P/E ratio.
- Trading multiples are often used alongside intrinsic valuation for a well-rounded perspective on investment value, offering both advantages and disadvantages.
- Utilizing trading multiples helps financial professionals gain multiple viewpoints on an investment's true worth, enhancing decision-making.
How To Create A Comparable Trading Multiple
To create comparable trading multiples, first, you need to find comparable companies.
Comparable companies should have a large amount of commonality with the target company. Similarities include:
- Industry
- Capital structure
- Market capitalization
- Products and services
- Geographical location
- Customer profile.
Often it won’t be easy to locate companies that perfectly resemble the target company. Therefore, when searching for comparable companies, it is essential to allow room for flexibility.
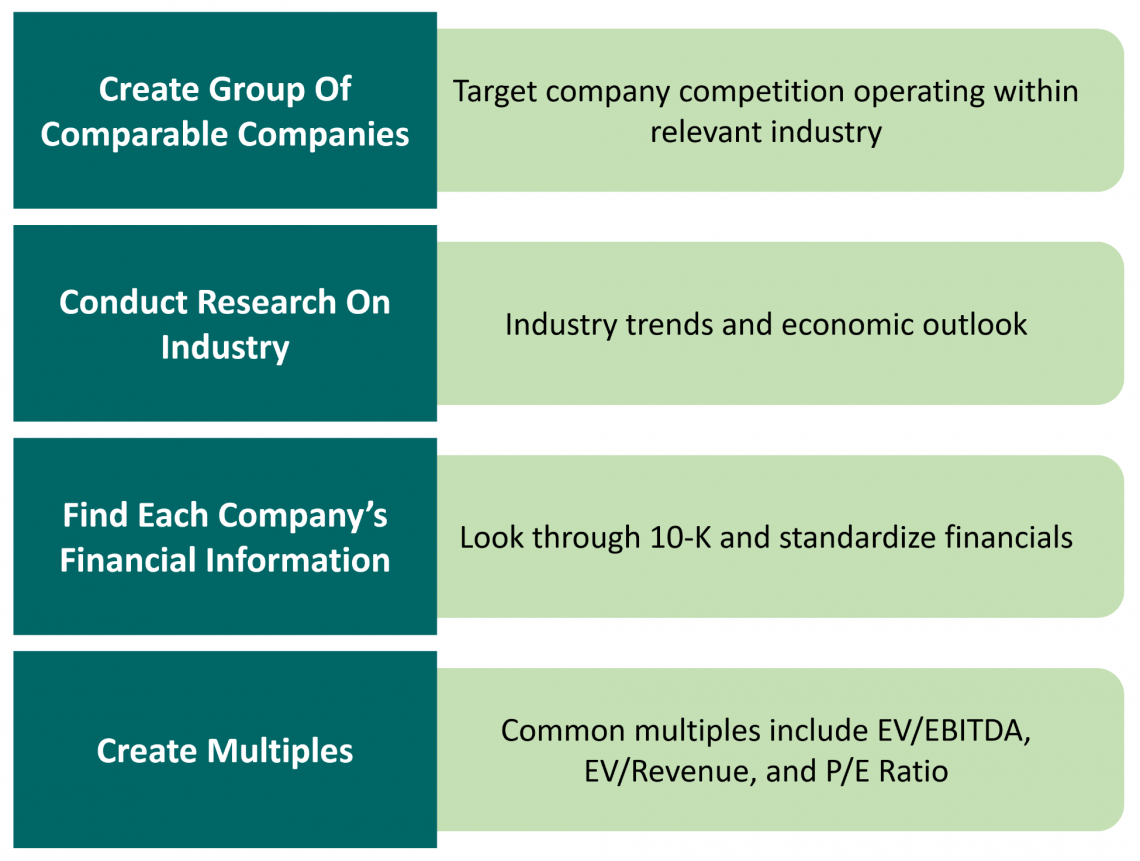
After creating a group of comparable companies, the next step is to research the relevant industry. Research should include industry trends, economic outlook, industry risks, and financial forecasts.
The research involves finding the financial information associated with each company within the group of comparable companies (also called peers).
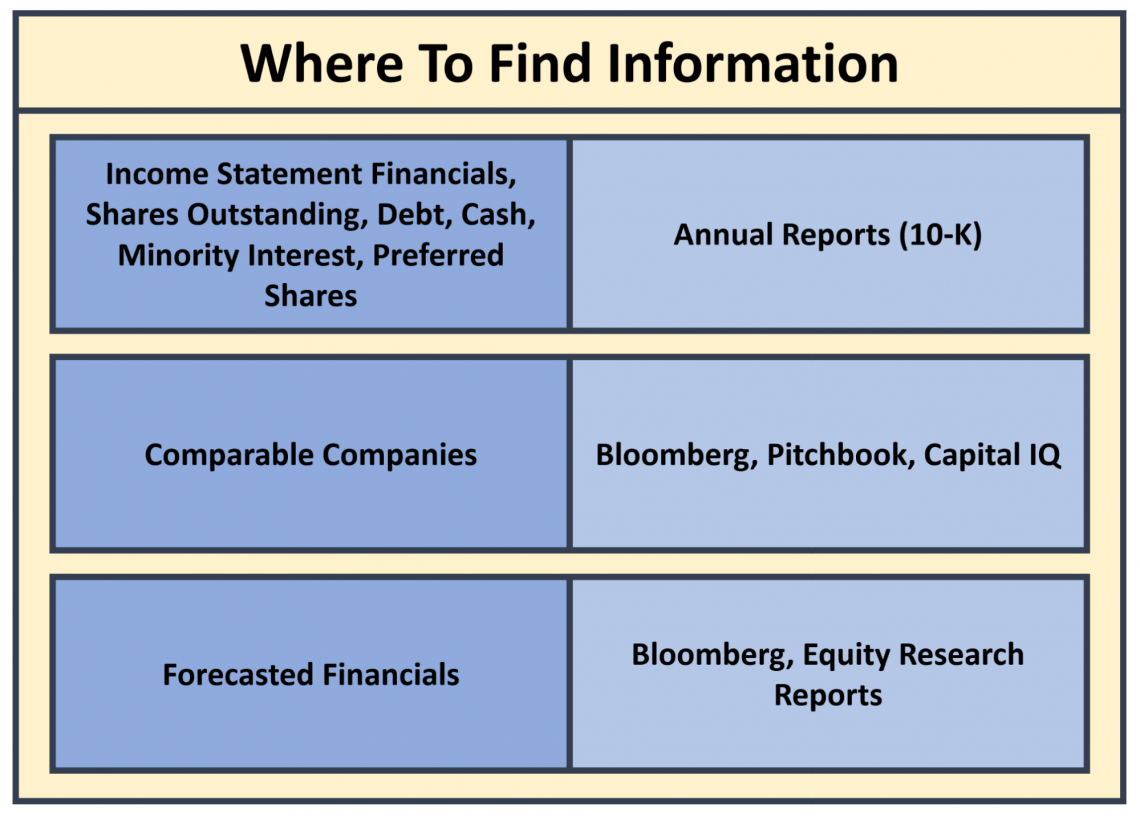
Relevant information can be found in each company’s annual report or 10-K, quarterly report or 10-Q, investor prospectuses, management estimates in the MD&A section on the 10-K, sell-side financial forecasts, Bloomberg, Capital IQ, and Factset.
It is essential to understand each company’s accounting methodologies so that financials can be standardized. Standardizing financials allows for increased accuracy when comparing companies and deriving industry multiples.
Equally as important is to look for non-recurring expenses that distort the financials of the comparable companies. If non-recurring expenses are found, an analyst should consider removing them from the company’s financials to create a more accurate picture of its ongoing financial state.
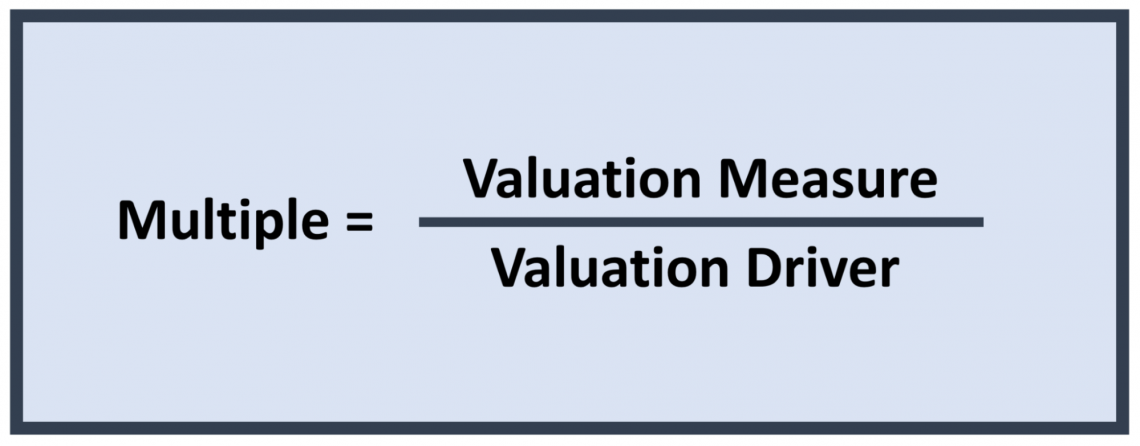
The next step in the process is calculating the multiples. A multiple should have a measure as the numerator and a driver as the denominator.
For example, enterprise value (EV) can be a valuation measure, while EBITDA can be a valuation driver. So we would take enterprise value and divide it by EBITDA to get the EV/EBITDA multiple.
When enterprise value is the numerator, it is considered an operating multiple. Meanwhile, if market capitalization is the numerator, it is considered an equity multiple.
Common denominators include revenue, EBITDA, and EBIT.
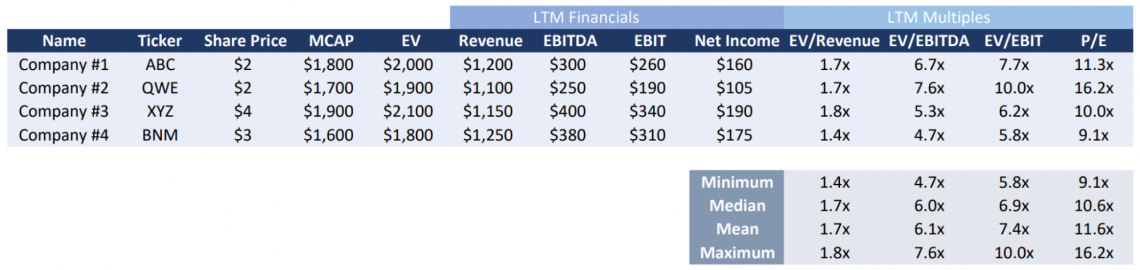
Often an additional table is created below the comps table to highlight the general output of the comparable companies. For example, finding a mean, median, minimum, and maximum is common in the additional table.
The final step compares the target company’s trading multiples to the multiples in the data set. If the target company is trading below the mean or the median, the company is relatively undervalued. Conversely, if the target company is trading above the mean or median, the company is relatively overvalued.
Popular Comparable Trading Multiples
The main comparable trading multiples used in comparable company analysis are EV/EBITDA, EV/EBIT, EV/Revenue, and the P/E ratio.
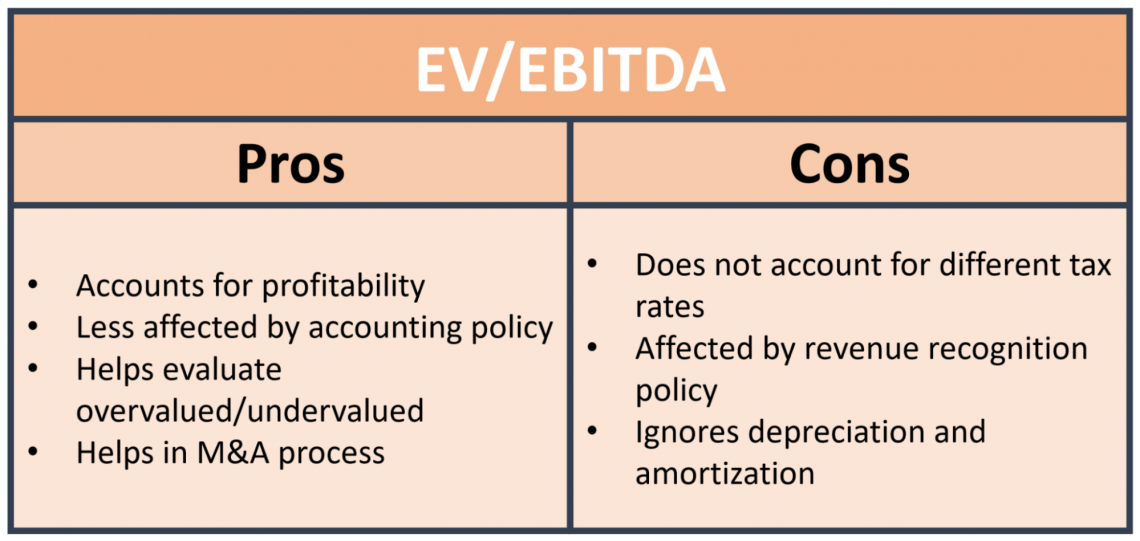
With the EV/EBITDA multiple, we compare a company’s enterprise value relative to its EBITDA. This multiple is excellent for determining a company’s profitability. It is also useful with the mergers and acquisitions process for assessing the acquisition cost of a target company.
Due to the use of EBITDA in the multiple, it does not account for a company’s annual tax provision. This leads to difficulty when comparing companies that have different tax rates.
If a company within the data set has a different revenue recognition policy, then earnings will become distorted. Therefore, understanding each company’s accounting methodology is essential so that financials can be standardized as not to produce unnecessary outliers within the data set.
Another difficulty inherent in the EV/EBITDA multiple is the disclusion of depreciation and amortization (D&A). For example, if a specific company in the data set has many capital expenditures, D&A will not be reflected in EBITDA but in net income.
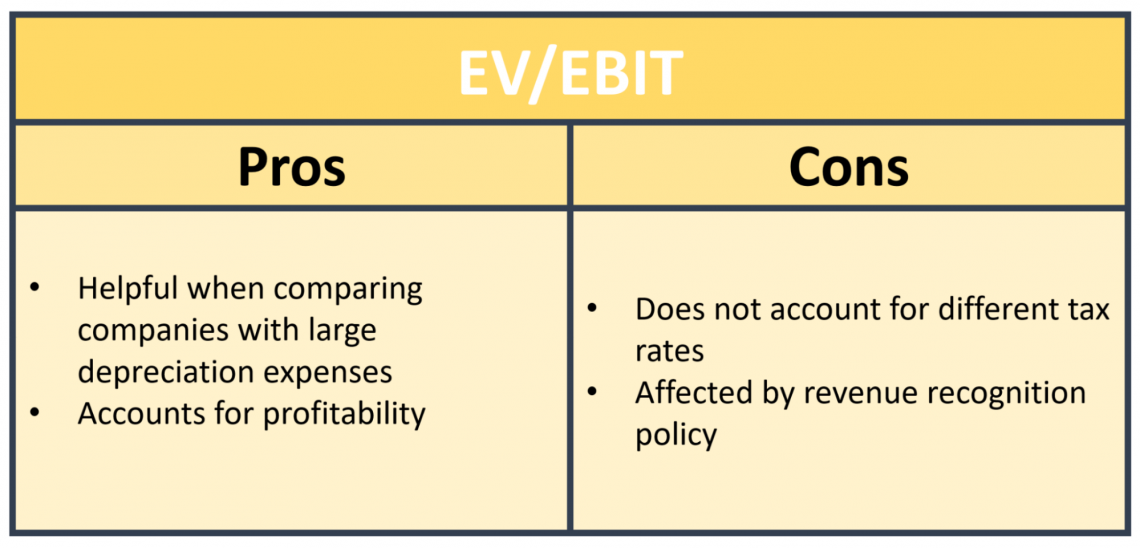
The EV/EBIT multiple provides a sound solution for the D&A issue when using EV/EBITDA. With EV/EBIT, depreciation and amortization are included in the formula. Therefore, companies within the data set that have large D&A expenses will have those expenses accounted for in the multiple.
The trouble with EV/EBIT arises from the disclusion of taxes and potentially distorted earnings produced by varying revenue recognition policies.
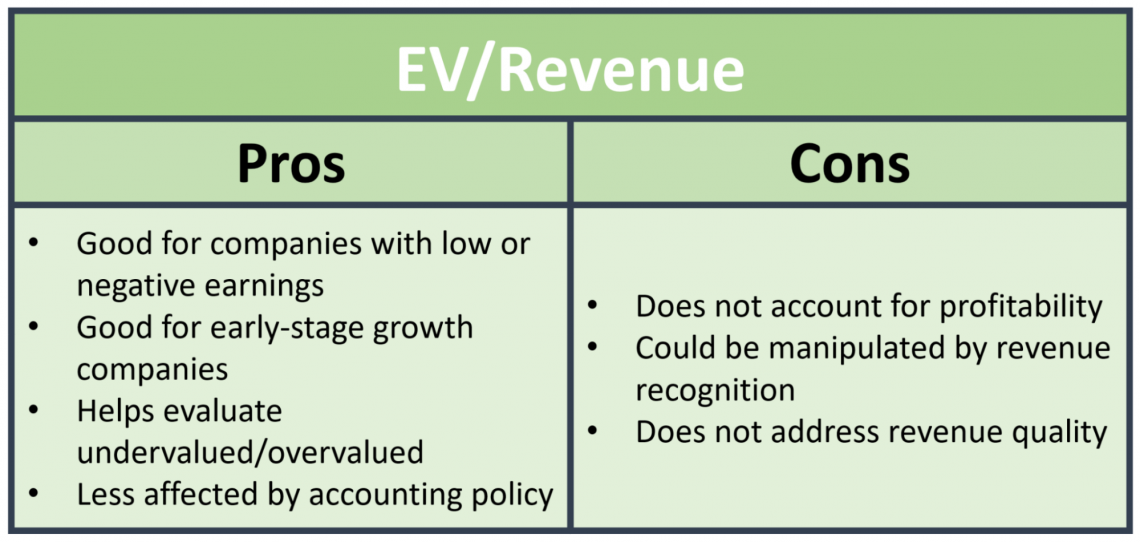
The EV/Revenue multiple is perfect for companies that are yet to become profitable. Often these companies are in their early stages of growth and are producing negative EBITDA.
The trouble with this metric is that a company’s revenue recognition policy can manipulate revenue. An additional difficulty surrounding this multiple is that it measures the last twelve months of a company’s revenue. This measurement does not account for revenue volatility or the reliability of future revenue.
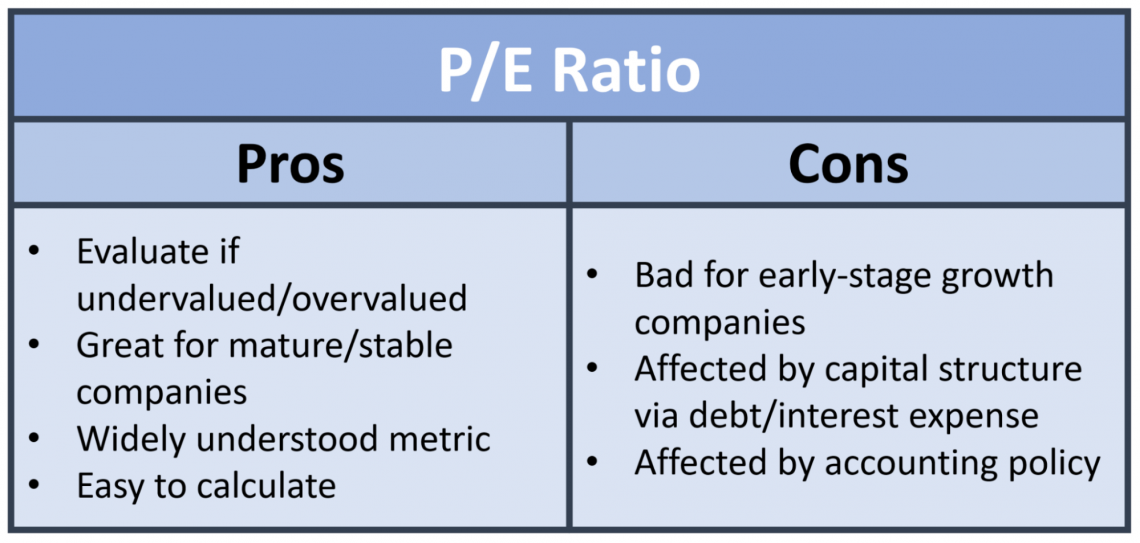
Generally, this measure is applied to mature companies that have achieved financial stability. However, for companies in their early stages of growth, earnings per share may not be the best metric to utilize as early-stage companies often have low or negative earnings.
Negatives associated with the price-to-earnings ratio include sensitivity to capital structure and sensitivity to accounting policy.
Pros And Cons Of Comparable Trading Multiples
The use of trading multiples comes with some advantages and disadvantages. Financial professionals commonly utilize trading multiples in tandem with an intrinsic valuation to receive multiple perspectives on the proper value for a given investment.
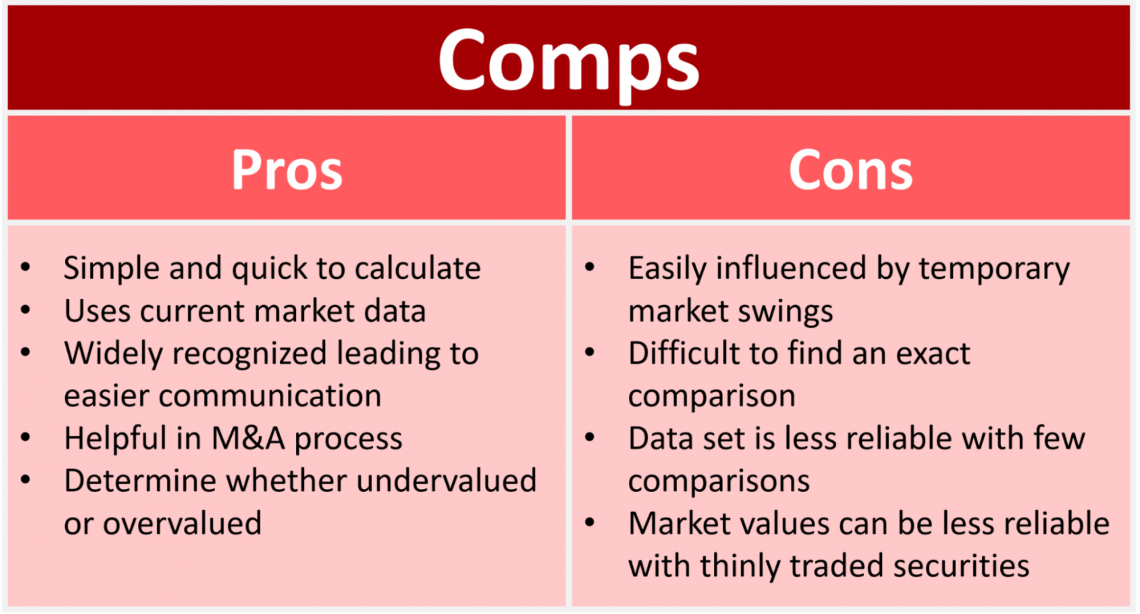
Advantages associated with comparable trading multiples include:
- The ability to quickly calculate: Relative to discounted cash flow analysis, trading multiples are measures that can be promptly formulated.
- Simple to understand: Trading multiples are widely recognized across the financial industry and provide a quick and easy way to communicate the value of an investment.
- Useful in the mergers and acquisitions process: While intrinsic value helps analysts understand the value of a company based upon its capital structure and profitability, trading multiples act as a form of relative valuation, assisting analysts in understanding the value of a company as perceived by the overall financial market.
Disadvantages associated with comparable trading multiples include:
- Market values are highly sensitive: Valuations can deviate from the intrinsic value in highly speculative periods.
- Market values for securities that are less popular will be thinly traded: The lack of liquidity for these securities causes share prices to become volatile, which can lead to inaccurate valuations.
- It can be very difficult to find exact comparisons: Often, a group of comparable companies will at best be roughly similar as opposed to exactly similar.
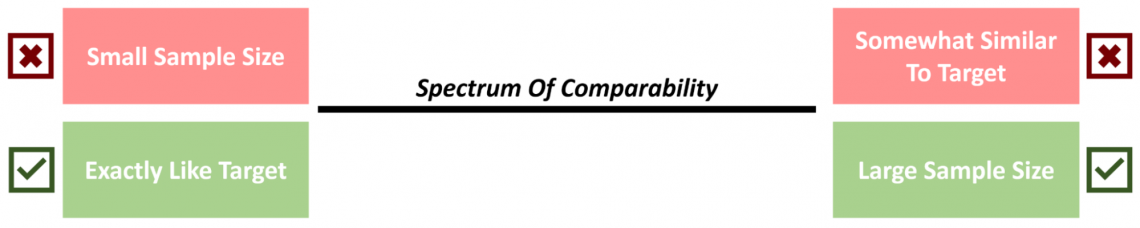
When comparing companies, there is a spectrum of comparability. The smaller the sample size, the more you can increase the comparability. Although this may not be the most optimal path for fewer comparable companies, it decreases the accuracy of a valuation.
Meanwhile, you increase the accuracy of a valuation with a large sample size due to the larger data set. However, you lose accuracy by filling the data set with companies that are only roughly similar to the target company as opposed to exactly similar.
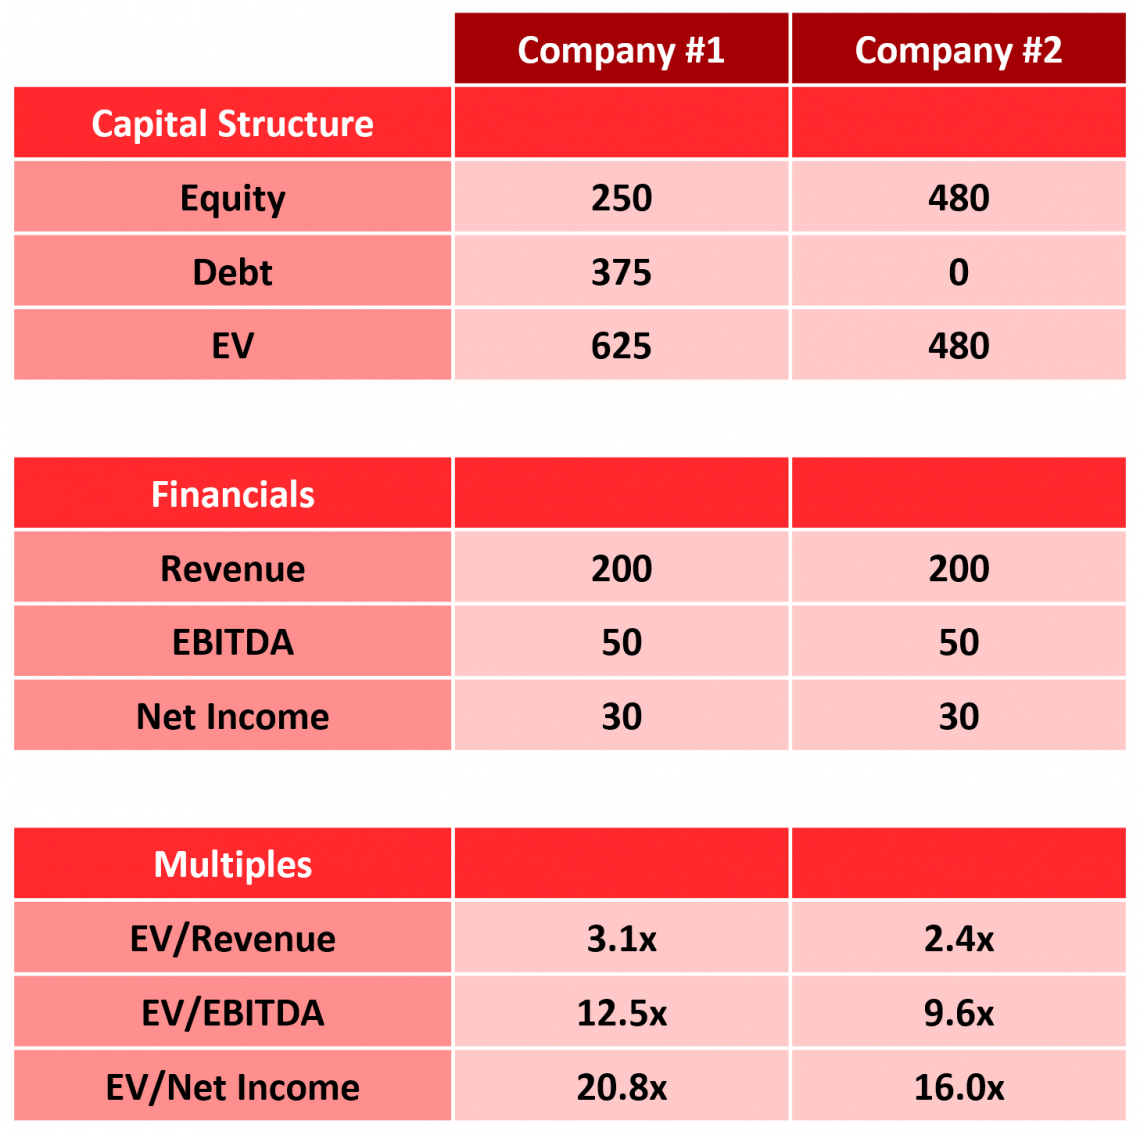
- Comparable trading multiples are easily affected by differences in capital structure: The diagram above highlights this dynamic. Company #1 and Company #2 both have the same annual revenue, EBITDA, and net income. Despite these similarities, their multiples are pretty different.
Company #1:
- EV/Revenue multiple of 3.1x
- EV/EBITDA multiple of 12.5x
- EV/Net Income multiple of 20.8x.
Company #2:
- EV/Revenue of 2.4x
- EV/EBITDA multiple of 9.6x
- EV/Net Income multiple of 16x.
The difference in multiples is caused by the varying capital structures between the two companies.
Company #1 has 250 in equity and 375 in debt for a total of 625 in enterprise value.
On the other hand, Company #2 has 480 in equity and 0 in debt for an enterprise value of 480.


Free Resources
To continue learning and advancing your career, check out these additional helpful WSO resources:


or Want to Sign up with your social account?