Technical Analyst
A financial professional who uses historical market data and technical indicators to make investment and trading decisions


What Is A Technical Analyst?
A technical analyst, often called a chartist or technical trader, is a financial professional who uses technical analysis to predict the future price movements of securities, such as stocks, bonds, or commodities, based on past market data, primarily price and volume.
Technical analysts operate on the principle that historical price movements can indicate future price trends. Its responsibility is to keep track of changes in the capital market by using technical indicators to make various investment and trading decisions.
The analyst might, for instance, monitor information on share price, trade volume, interest rates, etc., and apply this data to make decisions, such as whether to buy or sell the instrument.
Some tools these analysts use to judge the stock are:
- Derivatives
- moving averages
- on-balance volume
- price oscillators
- momentum indicators like RSI and pattern recognition, etc.
These analysts apply such tools for forecasting and timing the trading and investing in financial instruments.To predict future performance, technical market analysts look at tendencies in the previous version of financial securities.
These highly specialized experts are taught to read figures, charts, and graphs to produce projections or limitations for a specific stock or the larger markets.
Key Takeaways
- Technical analysts track and trade capital market movements using technical indicators to make investment and trading decisions.
- They use tools such as moving averages, on-balance volume, price oscillators, and pattern recognition to forecast and time trading and investing in financial instruments.
- To become a technical analyst, one can obtain an undergraduate degree in finance or a related field, pursue postgraduate studies, and obtain certifications like CFA or CMT.
- Technical analysts analyze historical data, charts, and graphs to produce projections and make decisions about specific stocks or the broader markets.
How to become a technical analyst?
To become one, you should obtain an undergraduate degree in finance, accounting, or a comparable field. Also, consider pursuing a postgraduate study in business or finance, such as a master of business administration (MBA) degree.
After that, your career path will be primarily determined by the certifications you gain and the employers you target. You can boost your chances of becoming an analyst by taking the chartered financial accountant (CFA) exam, post finishing the necessary education.
Financial institutions and prospective employers frequently accept this qualification for such roles. It exhibits financial market expertise and knowledge of the standards and ethics of offering market analysis.
Once you become an analyst, you can join professional organizations and earn various levels of certification that help you grow and keep your skills up to date.
Finance professionals can join the Market Technicians Association(CMT), a trade group where they can discuss and set standards for the sector. This specific organization provides technical analysis certification training for professionals.
Participants must show some proficiency in technical analysis to pass the tests and obtain the title of chartered market technician. There are different certification levels. With certification, you should advance and gain more recognition as a technical analyst.
Technical Analysis Training
Technical analysis training is also available for professionals pursuing and obtaining chartered financial analyst qualifications. So if a CFA wants to become an analyst, they can follow the CMT course in the USA or depend on the country's requirements.
This inclusion aids the expansion of the technical analysis domain within the financial services industry in the economic analysis curriculum. Technical analysis involves not just looking for patterns in equities but also in more complex financial instruments like currency and commodity products.
There are several service providers in the enormous industry of financial services. A technical analysis division is often found at major financial institutions, including investment banks.
These experts could assist other banking experts when making investment choices by providing insights following market expectations. Further on in the career path as a tech analyst, people frequently think about looking for a job at an investment bank where they can impact other market participants' actions.
Strategies used by the Technical analysts
Technical indicators are based on a mathematical formula that forecasts the direction of the financial markets using historical data on price, Volume, or open interest (in the case of futures contracts)
A key component of technical analysis is the technical indicators, which are frequently plotted on chart patterns to try and forecast the market trend.
Generally, indicators are overlaid on price chart data to show the direction of the price or whether it is in an "overbought" or "oversold" position.
Many indicators can be shown on the charts. However, the following list includes some of the traders' most significant technical indicators.
MACD - Moving Average Convergence/Divergence
One of the most popular technical indicators is the Moving-Average Convergence/Divergence line (MACD). It indicates trends as well as a stock's momentum.
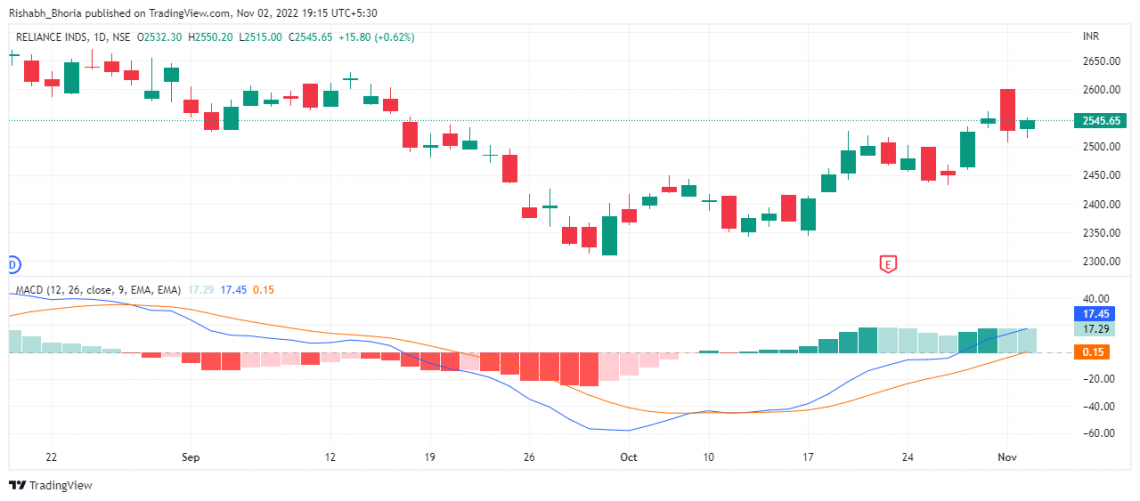
To predict a stock's future direction, the MACD line examines a stock's short-term and long-term momentum.
Simply put, it compares the two moving averages, which can be adjusted for any desired period. The most frequently used moving averages are 12-day and 26-day moving averages.
Future stock trading activity can be predicted when the short-term line crosses the long-term line. The stock will usually trade higher when the short-term line crosses the long-term line after running under it. Similarly, we can anticipate a selloff when the short-term line crosses below the long-term line.
Head and Shoulders Pattern
The head and shoulders is a chart pattern that develops when a stock rises to a peak to make the first "shoulder" and then falls.
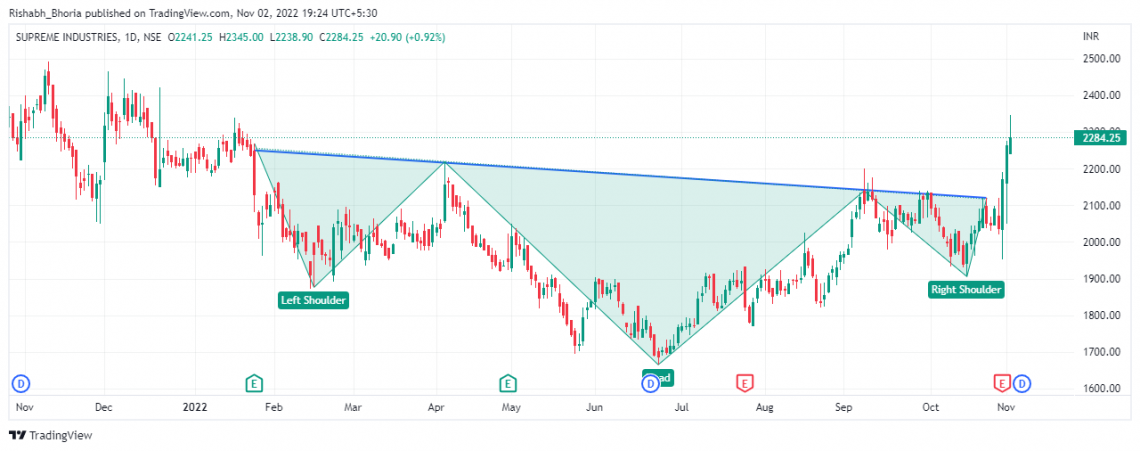
It then rises over the previous peak to create the "head," which falls below the first shoulder, rises once more to the first shoulder's level, descends, and thus forms the second shoulder.
Tech analysts regard a head and shoulders pattern as a reliable sign of shifting trends. If one of your holdings starts exhibiting this pattern, it can signify that selling is imminent.
When a stock price reaches its peak and then declines back to its base point, a head and shoulders pattern is established regarding the technical analysis of stocks. The stock price will then rise above the prior peak and develop a "nose" at that point.
The stock price will then rise to the level of the first peak, followed by a decline in the initial cost. When a bullish to bearish trend reversal is about to begin, this pattern frequently appears on stock charts.
Gaps
A gap occurs when a stock opens significantly higher or lower than its closing price from the previous day. This variation can result from news reported before the market's opening.
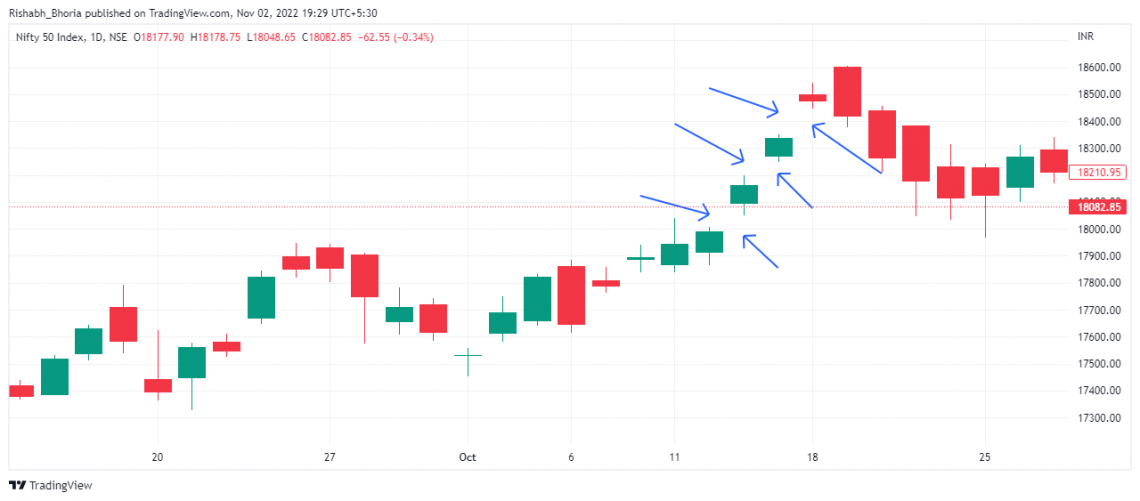
When the regular trading day begins, the stock picks up since this could cause a significant move during after-hours trading. Gaps are crucial because they generate new lines of defense or resistance to stock. Traders use support and resistance levels to create buy and sell orders.
You should be aware that common gaps are not priced in price patterns. They merely serve to show where a stock's price has gapped. Runaway gaps, also known as continuation gaps, are a phenomenon that can happen in the middle of a pricing trend.
They imply a flurry of buyers or sellers who agree on the direction an underlying stock will take in the future. Gaps are a price range when no shares have changed hands, to put it simply.
On-Balance volume
On Balance Volume (OBV) calculates the cumulative buying and selling pressure by deducting Volume on down days and adding Volume on up days.
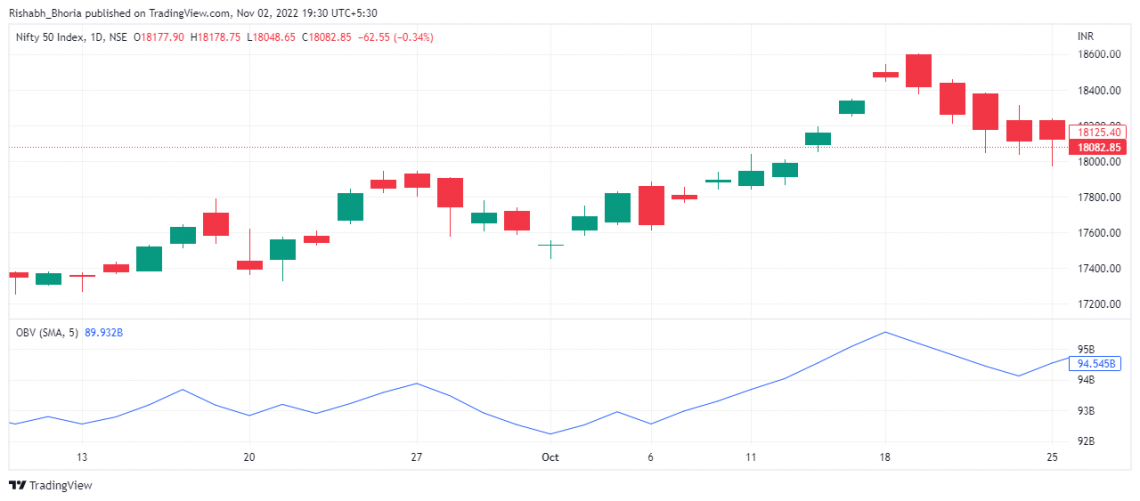
On-Balance Volume is created by Joe Granville, one of the earliest indicators for measuring positive and negative volume flow.
In his opinion, the price will ultimately leap when Volume suddenly increases without significantly changing the stock's price. It will eventually drop when Volume declines sharply without substantially changing the stock's price.
Relative Strength Index (RSI)
J. Welles Wilder created the Relative Strength Index (RSI), a momentum indicator that analyzes the rate and variance of price changes. The RSI moves between zero and one hundred.
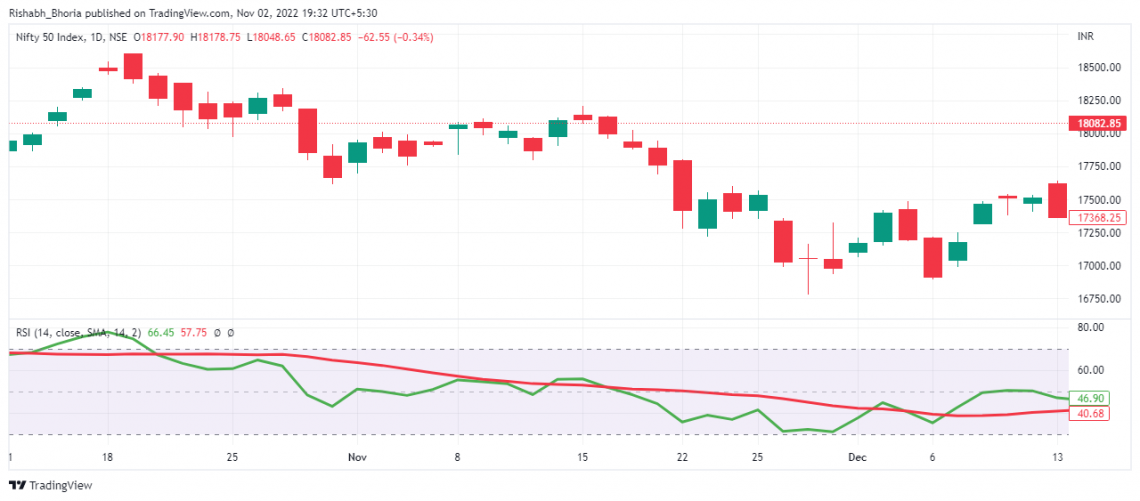
The RSI is typically overbought when it rises above 70 and oversells when it falls below 30. Searching for divergences and failure swings can produce signals. Additionally, the broad trend can also be determined using RSI.
These are just some of the technical indicators most frequently used by traders.
Certification and Licensing of Technical Analysts
Each country has its requirements as to what certifications and licenses are needed to become a tech analyst. But the leading institution that provides certification is The Financial Industry Regulatory Authority(FINRA).
Apart from FINRA, the Chartered Financial Analyst (CFA) certification is a well-known title for all financial analysts and is held by more than 150,000 individuals worldwide; the program's final exam and level 1 curriculum cover technical analysis principles.
CFA Institute, a global organization for investment professionals, is regarded as the industry's benchmark. It grants various financial certifications. The CFA Institute also offers the Chartered Financial Analyst (CFA) designation.
In financial analysts, credentials like the CFA qualification may help a prospective candidate stand out.
The Chartered Market Technician (CMT) designation from the CMT Association and the Certified Financial Technician (CFTe) from the International Federation of Technical Analysts are two credentials that explicitly display technical analysis expertise (CMT).
In general, open positions for tech analysts tend to get many applicants. Holding a tech analyst certification and pursuing a graduate degree can help job seekers stand out to employers.
Job Description of a Technical Analyst
Financial analysts who specialize in forecasting the stock market's direction are certified, technical analysts. These forecasts are based on previous market trends, current investor sentiments, and market data analysis.
These professionals provide their clients with trading and investment advice after thoroughly forecasting stock market trends. Technical analysts research a range of financial investments, including equities, futures, and interest-rate products.
Certified tech analysts analyze data taken from financial markets using spreadsheets and automated statistical tools to spot trends, anticipate the future, and develop investment strategies.
The information in this article may assist you in deciding when it comes to understanding what a tech analyst does and whether or not you should pursue a career in this field.
According to the Bureau of Labor Statistics(BLS), the growth rate for technical analysts is "faster than average" compared to other occupations, coming in at 9% between 2018 and 2028. Demand for this profession has seen a significant rise in the past decade, which will only increase from here on.
Fifty-six thousand new positions for technical analysts are expected to become available by 2028.
According to the U.S. Bureau of Labor Statistics (BLS), the median annual wage for certified technical analysts was $83,660 as of May 2020. According to the BLS, this profession is expected to expand 5% faster than the national average between 2019 and 2029.
Technical Analyst FAQs

A technical analyst must have a specific educational background, training, and a curated set of abilities. Technical capabilities, communication abilities, and analytical prowess are just a few traits that top analysts frequently possess.
Communication is crucial because one of their primary responsibilities is advising the company's leadership on investment opportunities.
Another crucial skill for Analysts is properly examining stock market data and concluding it.
Finally, exceptional analysts must be proficient with various computer tools and software to comprehend the stock market and predict possible investments.
Most of the analyst's day is spent analyzing stock market movements. They analyze the overall market, international markets, or particular stocks or funds their organization is particularly interested in.
In addition to conducting research and analysis, analysts frequently hold meetings with the company's executives to advise them on upcoming investment projections and other possibly profitable investment opportunities.
Although technical analysts and stock brokers deal with financial markets and investments, their approaches and goals differ greatly.
Most often, analysts are employed by huge companies that interact with the stock market to enhance their holdings by investing a portion of their money.
Analysts research and advise the management of the business on potential investment opportunities.
Contrarily, stock brokers assist people and businesses in actually buying stocks or other similar assets, such as mutual funds and index funds.
Instead of working for just one business or person, they typically have several clients.


or Want to Sign up with your social account?