Economic Indicators
Economic data usually showcasing macroeconomic information that is used to understand and interpret the past, current and expected condition of the economy


What Are Economic Indicators?
Economic indicators are economic data usually showcasing macroeconomic information used to understand and interpret the economy's past, current and expected conditions. They are primarily used to make and assess investment decisions and review how government policies perform.
All of the data is released on a timely schedule, usually every quarter, by the government; analysts and economists then use the data to assess the overall state of the economy.
There are no specific set criteria for what constitutes an economic indicator as all macroeconomic data is relevant in one way or another. Investors can choose from available indicators depending on what suits their current research.
The post-popular macroeconomic indicators used as economic indicators are:
-
Gross Domestic Product (GDP)
-
Inflation numbers
-
Employment rates
-
Crude prices
-
Energy Prices
-
Government spending
-
Net exports
-
Stock Market
-
Interest rates
These indicators can be used in tandem or on a standalone basis. However, most of these indicators are correlated, so they are usually used along with each other.
Economic indicators are also used to assess the overall risk of the economy. The risk can be assessed by comparing the economy's empirical data with some other more stable economy serving as a benchmark or with its peer group of economies.
Key Takeaways
- Economic indicators are key data used to analyze the past, present, and future states of the economy, important for investment decisions and evaluating government policies.
- Economic indicators are divided into three types: leading indicators for forecasting, coincident indicators for current analysis, and lagging indicators for confirming past trends.
- Leading indicators, like the yield curve and stock market trends, help predict economic movements and are used by businesses to plan ahead.
- Coincident indicators, such as GDP and unemployment rates, provide a real-time snapshot of the economy's health and guide immediate economic assessments.
- Lagging indicators, including interest rates and corporate profits, confirm established economic trends, which is crucial for businesses in strategizing for upcoming economic cycles.
Types of Economic Indicators
These are broadly classified into three types:
-
Leading Indicators: Leading indicators are used to forecast and predict.
-
Coincident Indicators: Coincident indicators are used to understand the current state of the economy.
-
Lagging Indicators: Lagging indicators are used to confirm or reject economic trends.
These indicators showcase different types of micro and macroeconomic data that reflect different aspects of the economy through different time horizons. Also thet are indicators are relevant to different groups of individuals. Investors often use all of the indicators to arrive at an investment decision.
Usually, all economic indicators are used in tandem with each other to reach a decision. Even though economic indicators are good standalone indicators of the economy, their credibility increases substantially if used in tandem with each other or some other variable.
Businesses use these indicators to position themselves in the market, investors use them to alter their portfolios to suit the economic conditions better, and economists use them to set, alter and judge various economic policies.
Leading Indicators
Leading indicators, as the name suggests, are used to forecast future events that may happen. These are used by analysts and investors so they can position their portfolios for future scenarios by altering the weightage or further diversification.
Based on these indicators, businesses use leading indicators to anticipate future economic conditions and position the products, manufacturing, distribution, inventory, etc.
Leading indicators are essentially the opposite of lagging indicators, used to confirm trends rather than predict them.
Different indicators are used depending on the time horizon, type of industry, current economic condition, etc., and the indicators can also vary in accuracy.
The actual forecast completely depends on the analyst's skill set and how they utilize the available data. Just because the indicators signify the possibility of an economic event, it doesn't need to happen.
The indicator could be wrong, or some more recent changes made the data redundant; any of these could happen. The following are the most reliable and widely used leading indicators.
Yield Curve
The yield curve plots the yields of debt instruments (usually bonds) with different remaining maturities on a graph with the lowest maturities on the left and highest on the rightmost side of the X-axis. The y-axis shows the annualized YTM.
The debt instruments plotted on the yield curve should have the same risk profiles.
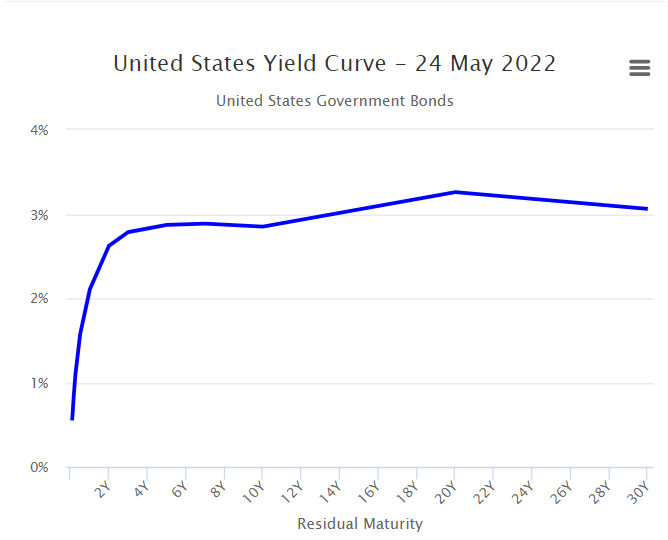
In the above image, United States government bonds of maturities ranging from >2 years to 30 years are plotted on the graph.
The "slope of the yield curve" or the "term spread" is the difference between the long-term and the short-term interest rates. The term spread historically has shown a negative relationship with real economic activity like the GDP.
A negative term spread is when the short-term interest rates rise above the long-term rates, it is considered an early warning sign of an economic downturn. This is because long-term rates are usually higher as they carry duration risk.
But a change in the risk attitudes, government policies, and other micro and macroeconomic factors can drive the short-term rates closer to or even beyond the long-term rates creating a negative term spread.
Usually, the term spread is at a lead of three to six quarters to the economic activity.
2-year rates are subtracted from the 10-year rates to get a term spread. As of Q2 2022(May 24th), the US10Y treasury bond is trading at 2.763%, and the US2Y is trading at 2.522%. The term spread is 0.241% or 24 basis points (bps).
Stock Market
The stock market is one of the most popular and reliable leading indicators for economic activities. It leads the actual economic condition by 3 - 6 quarters. The market is such a reliable leading indicator because it is very efficient at discounting the most recent news.
The Covid-19 fall is a great example of this. The market began to decline much before the reported cases started to rise at an alarming rate, and economic activity started declining.
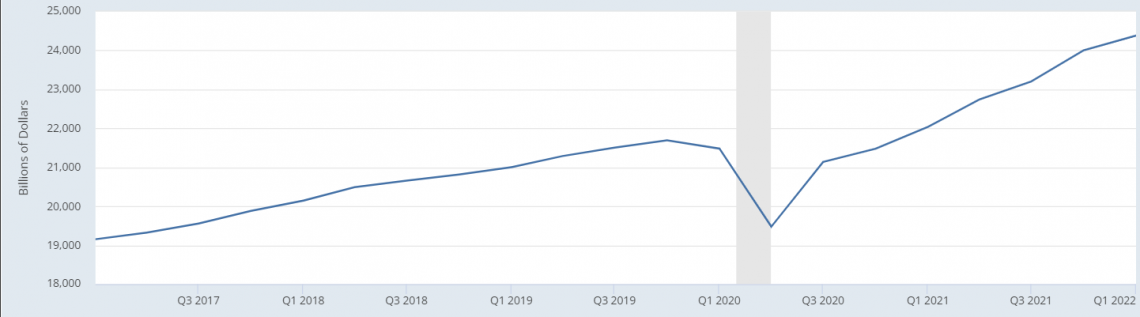
The S&P 500 corrected almost 30% in three months, even before the Q2 GDP numbers were published. It corrected because it reacted to the news and market sentiments, and the Q2 GDP acted as a confirmation of the lagging indicator.
The market can efficiently discount economic information because it reacts to the current news and the market sentiment in the market.
Investors and traders gain an understanding from their research, sources, and other indicators of how the current economic condition is going to be. During the first quarter of 2020, there were lockdowns and shutdowns worldwide, which is a negative sentiment, and the GDP was expected to shrink due to the loss of economic activity.
Thus the markets reacted much before the actual numbers were published.
Durable Goods Orders
Durable goods are goods that last longer than consumer goods like food. Durable goods are a very good leading indicator to showcase future economic conditions.
Vehicles, and household electronics like air conditioners, television, jewelry, etc., are considered durable goods. Therefore, purchasing durable goods can tell us a lot about what we can expect in the near future from the economy.
An increase in the sale of durable goods shows a rise in the public's disposable income, which will result in higher quarters for the companies and an overall increase in GDP due to an increase in per capita income and consumption.
Durable goods order volume also shows the availability of credit in the economy. Durable goods are high-ticket items and are usually not paid in full but paid through installments that are available on credit.
So if the purchase of durable goods is rising, there is a lot of credit available in the market as the rates are cheaper.
If the exact opposite is happening, orders of durable goods are shrinking; then it is evident that the overall disposable income is reducing, and credit is getting more expensive. This is either done artificially to reduce inflation or happens naturally as a part of the credit cycles.
The data for durable goods orders is available in the United States Census Bureau's monthly advance report on durable goods.
The orders for March 2022 increased by $2.3 Billion or 0.8% compared to February 2022. This means there has been a consumption increase in the past month.
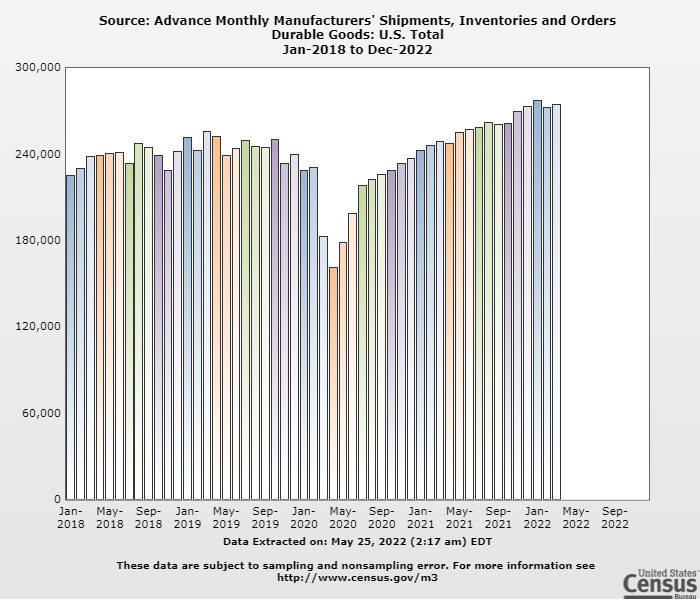
The above graph showcases the advanced monthly manufacturing shipments, inventories, and durable goods orders. The sharp drop in the first months of 2020 proved a very good leading indicator that suggested the overall market's direction and economy.
Coincident indicators
Coincident indicators change along with the current status of the economy and thus are the direct reflection of the economy as a whole.
Coincident indicators can also serve as confirmation for leading indicators down the line. Finally, coincident indicators are used to define the current economic condition. Whether the economy is in a recession, expansion, or stagnation, it can be understood by looking at these indicators.
Even though they reflect the most recent state of the economy, there still is a lag to the actual real-time figures because it takes time to report and publish the figures.
The U.S. Fed publishes a U.S. coincident economic indicator that uses relevant coincident indicators and combines them into one indicator, which can be used to reflect the overall state of the economy.
The indicators use non-farm payroll employment, unemployment rate, average hours worked in manufacturing, and wages and salaries as components of those indicators. These are a few of the most reliable indicators that reflect the immediate state of the economy.
The following are the most used and reliable coincident indicators.
Unemployment Rate
The unemployment rate is a direct reflection of the economy's current condition. A lower unemployment rate means that the economy's consumption and savings are stable and expected to rise with time.
If the unemployment rate increases, companies are cutting down the workforce due to falling demand.
The employment rate is directly related to the overall consumption in the economy.
If the economy is in turmoil, it will reflect a higher unemployment rate which means there is a drop in consumption, bank delinquencies will go up, and the overall risk in the capital markets will rise as the creditworthiness of the consumer drops.
The unemployment data is released every month. Because the information is released frequently, it is a good reflection of the economic activity and thus is a good coincident indicator.
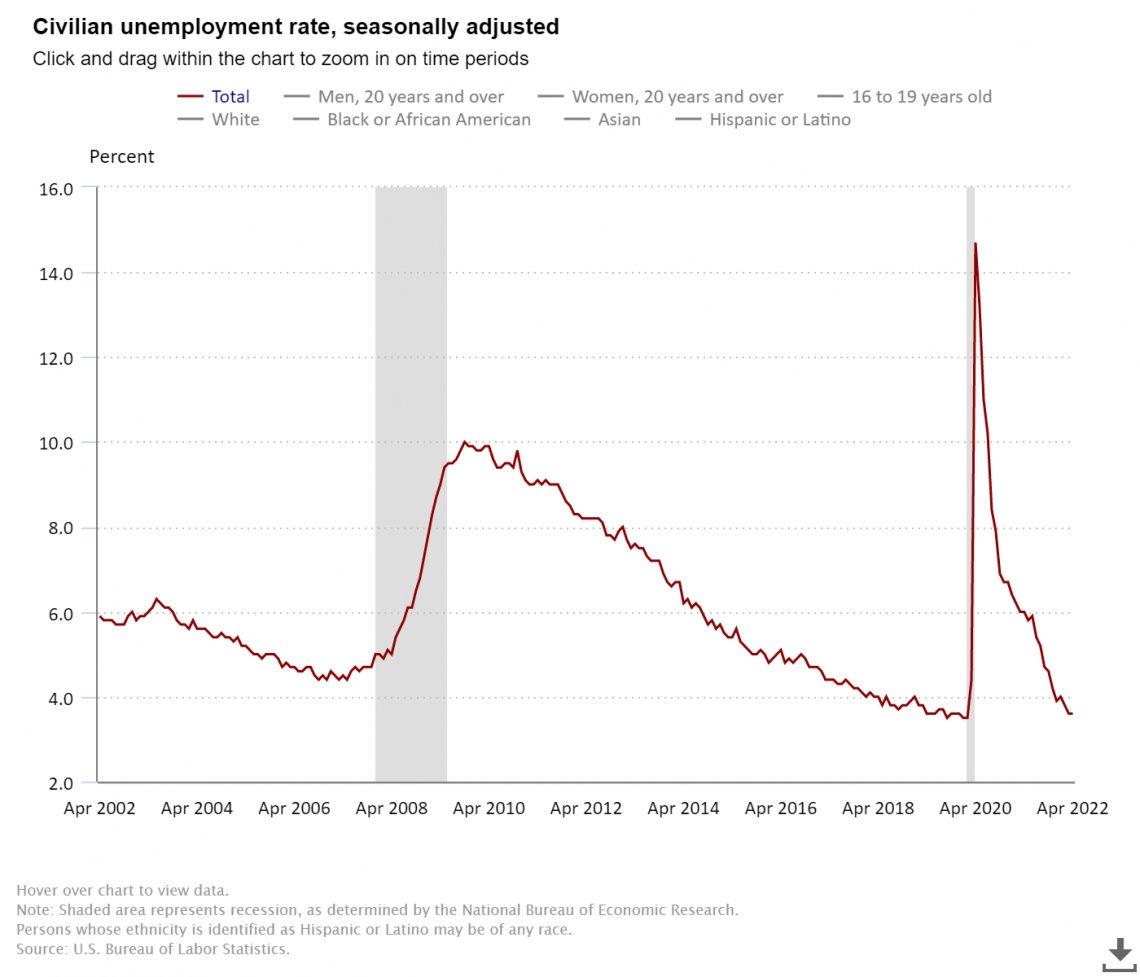
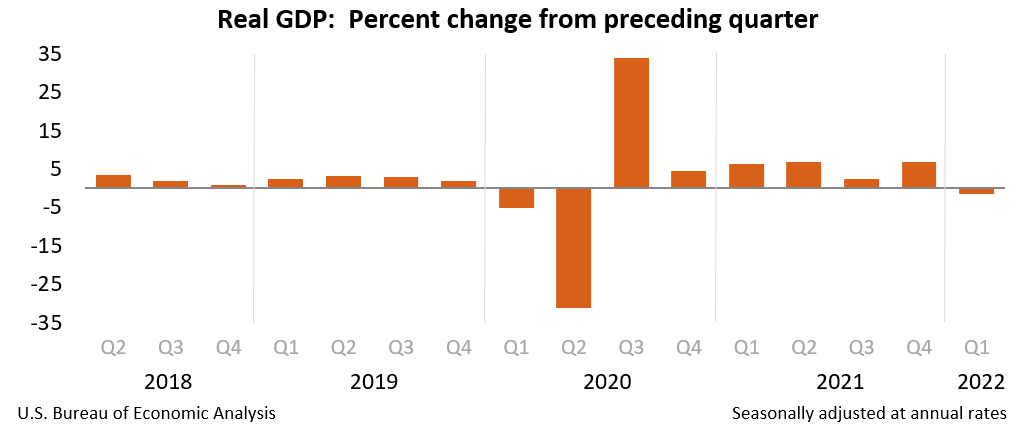
The sudden rise in the unemployment rate was in tandem with the economic condition of the U.S. At its peak, the unemployment rate was near 15% when the economy was at its worst, and the GDP had also fell by around 30%.

Gross Domestic Product (GDP)
GDP is also considered a coincident indicator. Even though the data is released quarterly instead of monthly, which creates a little lag, GDP is the most accurate representation of the economic condition of any country.
The formula for GDP is:
GDP = C + I + G + (X - M)
Where,
- C = Consumption
- I = Investment
- G = Government Spending
- X = Exports
- M = Imports
- (X - M) = Net Exports
Consumption (C) is the private consumption done by households and non-profit organizations, and investments (I) are business expenditures and home purchases by the household sector.
Government spending (G) is the money spent by the government on goods and services, and net exports (X - M) is the difference between exports and imports. If the net exports are positive, it is usually good for the economy.
The GDP is essentially the final value of the goods produced within the economic borders of a country within a specific period of time.
An economy's growth is directly related to its total production and how efficiently it is done, which is further shown by the GDP per capita.
The GDP is very reliable as an economic indicator because it reflects the overall state of the economy very accurately.
Average weekly hours worked on non-farm payrolls
The average weekly hours worked on non-farm payrolls is a good indicator of economic conditions. Farm payroll hours are eliminated due to their cyclicality.
In a sense, it works very similarly to the employment rate. The metric is usually more focused on manufacturing weekly payroll hours but can include other sectors.
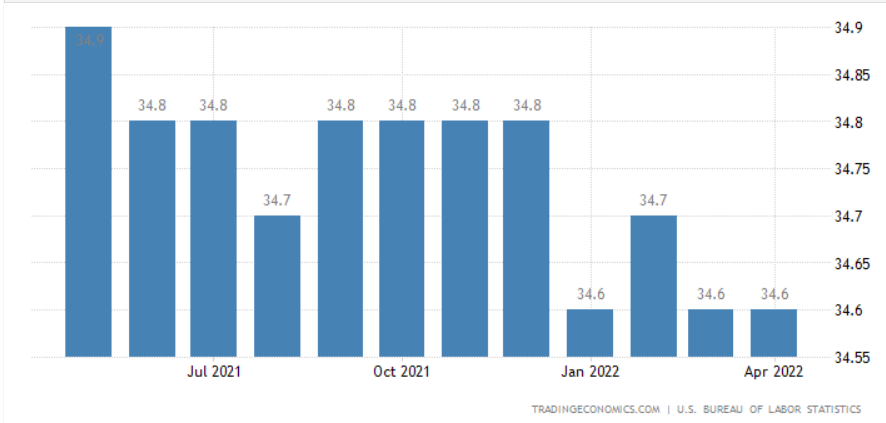
The weekly hours give an idea of the work done in a specific sector and what to expect. For example, if the weekly hours are falling, it is an indication that the sector is not doing so well.
If the manufacturing hours worked are rising, it is an indication that the economy is strengthening and demand is expected to rise down the line. Manufacturing hours are a good representation of the overall growth and demand in the economy.
Growth in hours of more service-oriented sectors like financial services, leisure, hospitality, etc., is a sign of higher per capita income; as the income goes up, so do the saving and spending. It also serves as a good representation of the availability of credit.
If the hours worked for leisure, hospitality, and durable goods manufacturing are going up, that means there is a lot of credit available in the economy.
Lagging Indicators
Lagging indicators react after an event has occurred. They may seem pointless as they react after the economic event, but they have their importance.
Lagging indicators are used for trend confirmation. Leading indicators are used for prediction, and coincident show the current state, but none of them show a confirmation of the trend; this is where lagging indicators come in handy.
Trend confirmation is essential to decide on the next step for a business and prepare for the next trend or to stay put if the current trend continues.
The main use of lagging indicators is to confirm that one economic trend has ended so the business can prepare for the next one.
For example, a consumer durables company can increase or decrease their production depending on which trend has finished. If they think an economic downtrend is over, they can focus on increasing production as the demand returns.
Following are some of the most reliable lagging indicators.
Interest rates
Interest rates are decided by the central bank depending on the economic situation. Interest rates always follow the trend; they are never decided before or during the economic trend and are always decided with a lag.
Interest rates are decided with a lag because they are an essential and instrumental tool and can be devastating if decided incorrectly. So the central banks usually wait to confirm the current economic situation and then decide on the rates.
If the interest rates go up, it means there is a lot of money and credit in the economy, and the central bank is aiming at squeezing the availability to bring down the rates. Similarly, it will drop the rates if there is low consumption as they want to bring the demand back up to grow.
The credit spreads and the yield spreads, which are kind of like derivatives of the interest rates, then serve as leading indicators.
On May 4th, 2022, the Fed bumped the rates by 50 basis points or 0.5%; this suggested that there was too much money in the economy and inflation was very high, so they needed to squeeze the supply of money in the economy.
Corporate Profits
Corporate profits are reported every quarter; the quarterly reports only contain the unaudited income statements & cash flow statements, the half-yearly reports contain the unaudited balance sheet, and the annual reports have the audited income, cash flow & balance sheet statements.
The quarterly corporate profits can show how the past quarter has been for the industry/sector by looking at the bottom line, top-line growth, margins, etc.
The half-yearly balance sheet can be used to judge the overall demand for the sector by looking at the inventory levels, cash levels, reserves, etc.
The balance sheet also shows if the capital spending for a certain sector is going up or down by looking at the investments in capital assets.
While looking at corporate profits, we need to look at all the companies or at least a few of the biggest to get an idea about the sector, and we need to look at all the corporate profits if we need to judge the entire economy.
Looking at corporate profits can be time-consuming as we must compile and analyze the data further. But it shows a very clear picture of how the entire sector did in a specific period.


Researched and authored by Aditya Salunke I LinkedIn
Free Resources
To continue learning and advancing your career, check out these additional helpful WSO resources:

or Want to Sign up with your social account?