Money Flow Index
AKA the Volume-Weighted Relative Strength Index (RSI) is a momentum indicator, as the index is similar to RSI, yet incorporates volume other than price actions only.


What Is Money Flow Index?
Money Flow Index (MFI) is a momentum indicator. It is also known as the volume-weighted Relative Strength Index (RSI), as the index is similar to RSI, yet it incorporates volume other than price actions only.
Created by Gene Quong and Avrum Soudack, this momentum indicator is a technical indicator that measures trading movement by analyzing price and time to determine whether market participants are buying or selling. Though it is not as popular as the Relative Strength Index, it is as effective as RSI.
The following article will look at how the index is calculated and interpreted. Further, we will also discuss the benefits and drawbacks of this technical indicator and trade signals and the combination of other technical indicators.
The following steps can be used to calculate MFI:
1. Calculate the typical price over a given period

- A rise in typical price implies positive money flow, indicating buying pressure;
- A decline in typical price represents a negative money flow, indicating selling pressure;
- If the typical price is unchanged, then that day is discarded.
2. Calculate the raw cash flow

The money flow is categorized into positive and negative money flow:
-
Positive money flow is calculated by adding the money flow of all days when the typical price is higher than the previous day's.
-
Negative money flow is calculated by adding the money flow of all days when the typical price is lower than the previous day's.
3. Calculate the money ratio
A money flow ratio, also known as a money ratio, is computed by summing positive and negative money flows.

4. Calculate the Money Flow Index

It can also be expressed as follows:

This form presents the indicator as a percentage of positive money flow to total money flow.
Key Takeaways
- The Money Flow Index (MFI) is a momentum indicator, also known as the volume-weighted Relative Strength Index (RSI).
- It was created by Gene Quong and Avrum Soudack to measure trading movement by analyzing both price and time, determining whether market participants are buying or selling.
- Research has shown that MFI can outperform a simple buy-and-hold strategy but requires parameter optimization for each stock.
- The advantages of MFI include the simple setup & understanding, identification of possible trend reversals, and divergences are more effective with volume.
What Does the Money Flow Index Tell You?
The money ratio determines this indicator, ranging from 0 to 100. Considering the volume, the indicator can be used to spot the highs and lows of price movement and reversals with various other signals.
Overbought/oversold, failure swings and divergences are the three primary indications generated by the indicator.
Overbought/Oversold Condition
If the index reveals a rapid price rise to a high level, the asset will be labeled as overbought. Likewise, if it shows a quick drop in price to a low level, the asset is oversold. Price extremities can be identified using the oversold and overbought levels.
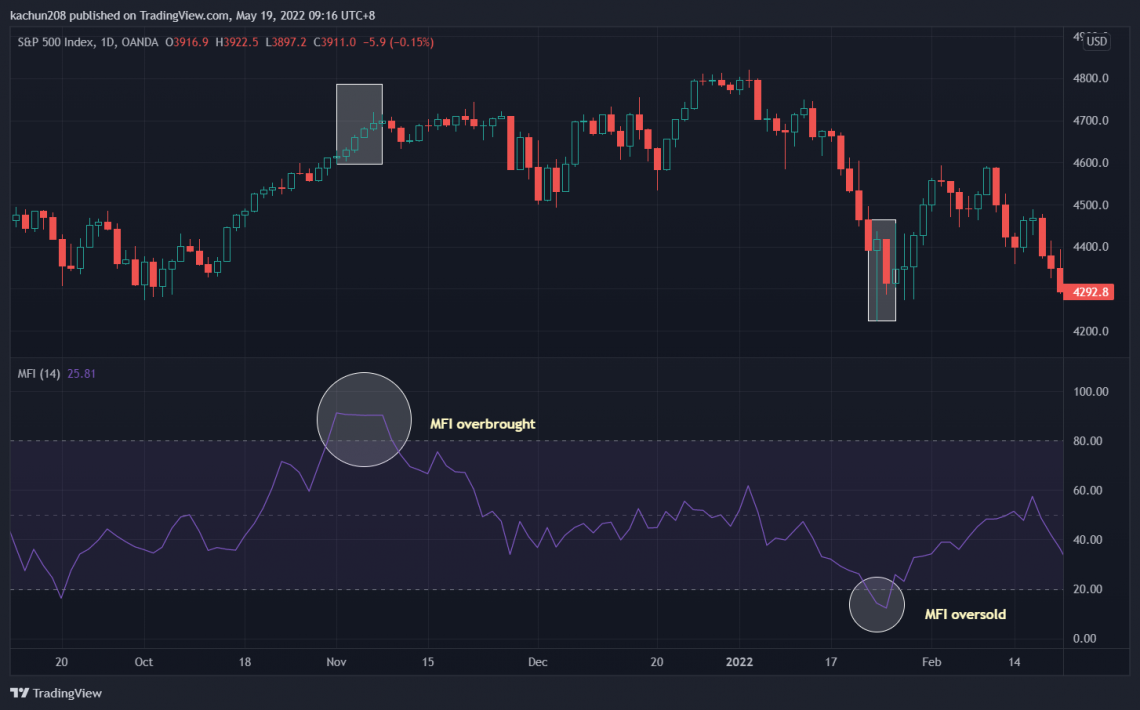
Overbought conditions exist when the Money Flow Indicator is above 80, while the oversold condition exists when it is below 20.
The SPX's MFI crosses over 80 for a few bars, indicating an overbought scenario, followed by a consolidation. An oversold condition develops when the MFI falls below 20, and a trend reversal occurs.
While the price explodes in an uptrend, the MFI indicator may soar above 80 for a period of time.
Conversely, if prices start to plummet amid a significant downward trend, the index might fall below 20. When the value rises above 90, it's deemed fully overbought.
Divergences
Divergence signals emerge when the price movement sends contradictory signals. The disparity in the indicators could indicate a possible reversal.
The divergences can be classified into two categories:
- Bullish Money Flow Index divergence
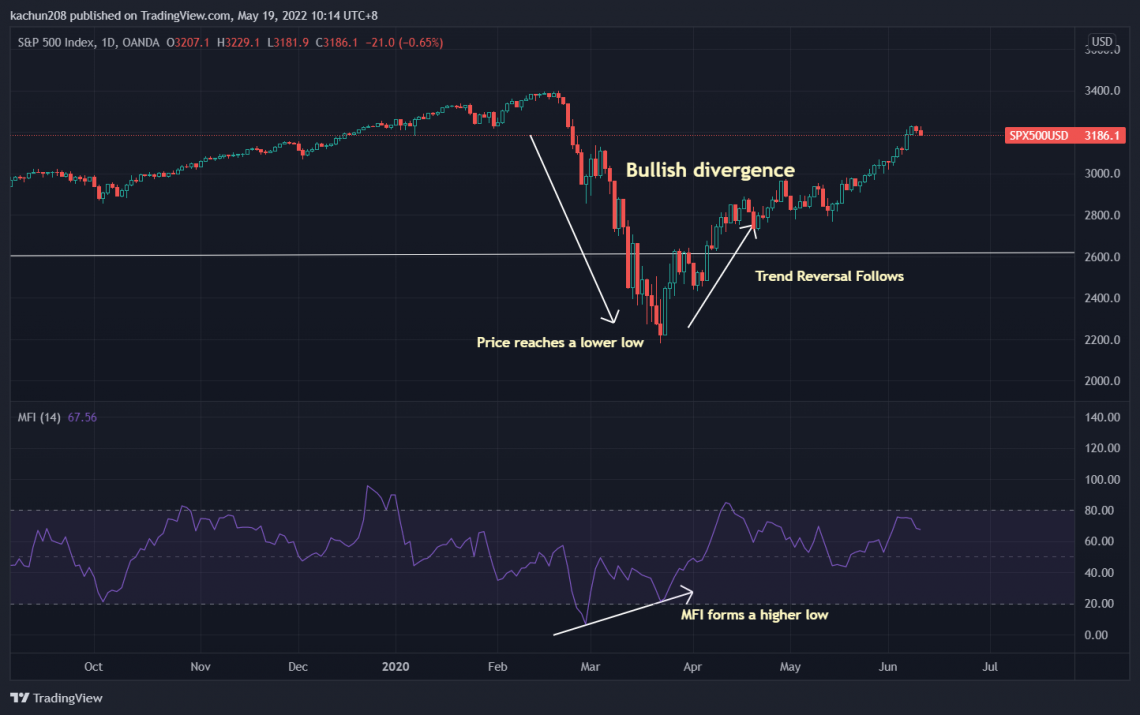
It offers an opportunity to purchase assets at a lower price. When the price falls to a new low with the index showing a higher low, it indicates an increase in money flow. As a result, the selloff diminishes, and buyers are expected to take over the market.
- Bearish Money Flow Index divergence
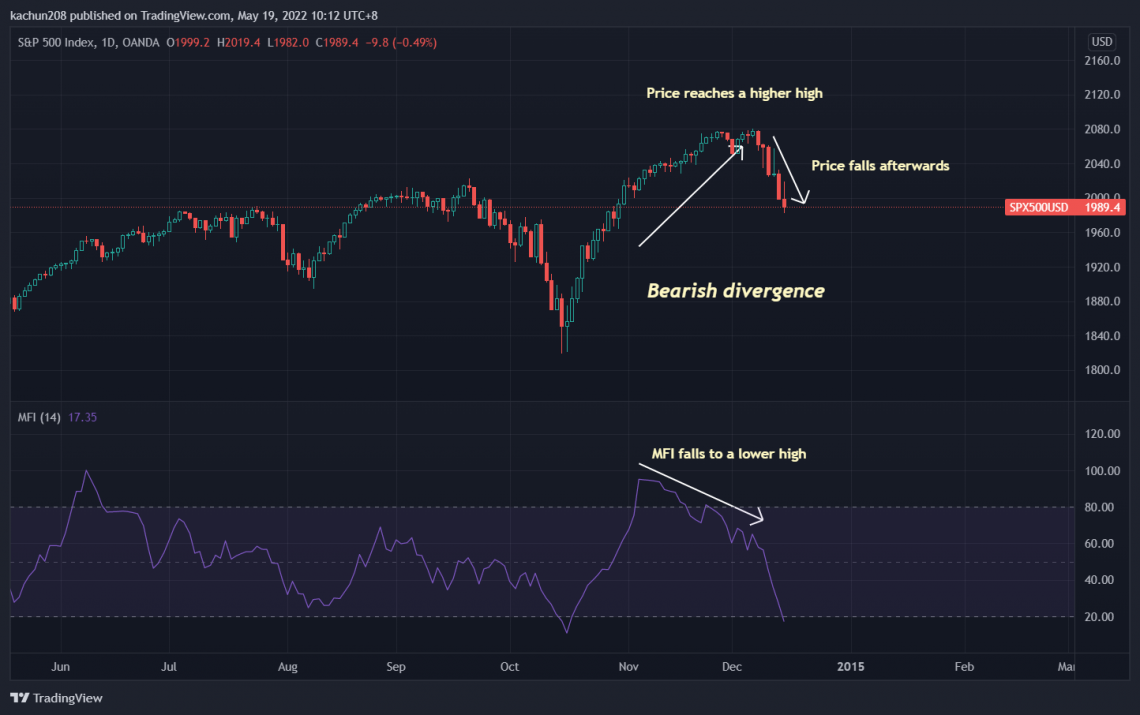
The bearish divergence happens when the price moves to a new high, whereas the index shows a lower high. It denotes a decline in buyer demand and the beginning of the seller's market takeover. It is a crucial selling point for sellers.
Failure Swings
Failure swings, like divergences, can lead to a price reversal. On the other hand, failure swings are unaffected by price and are entirely dependent on the Money Flow indicator.
There are four steps in the process of bullish and bearish failure swings.
- Bullish Money Flow Index failure swing
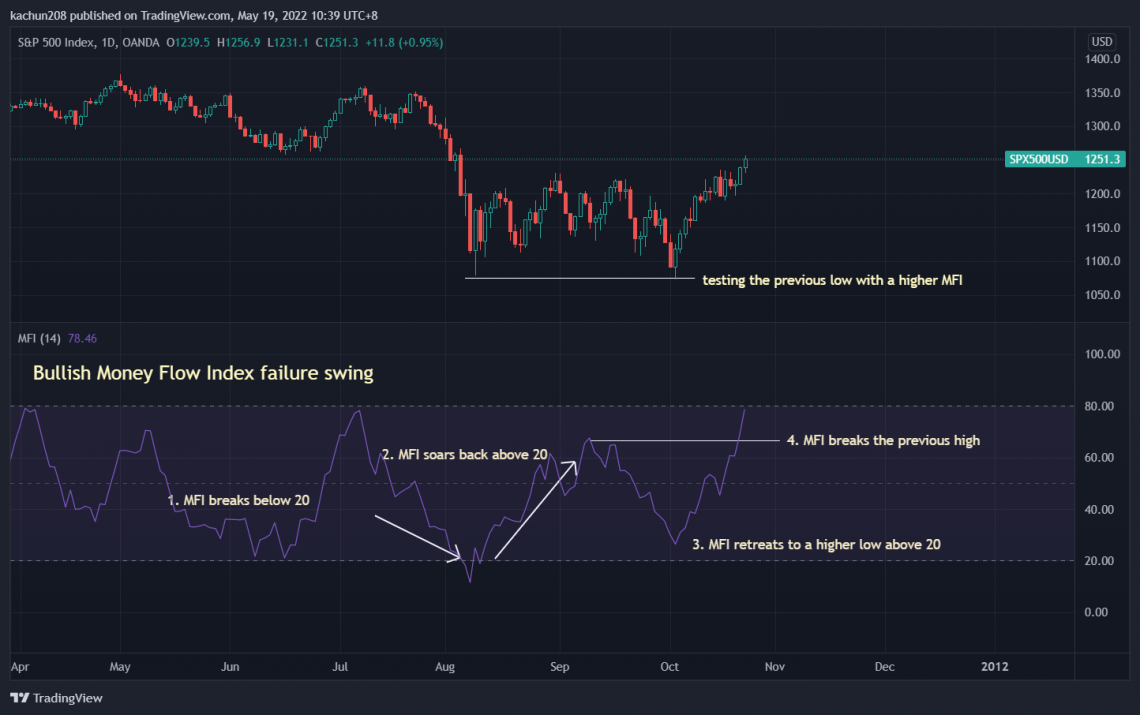
Step 1: The index falls below 20. (oversold)
Step 2: The index rebounds and passes beyond the 20-point mark.
Step 3: It falls but remains above 20.
Step 4: It surpasses its previous high.
- Bearish Money Flow Index failure swing
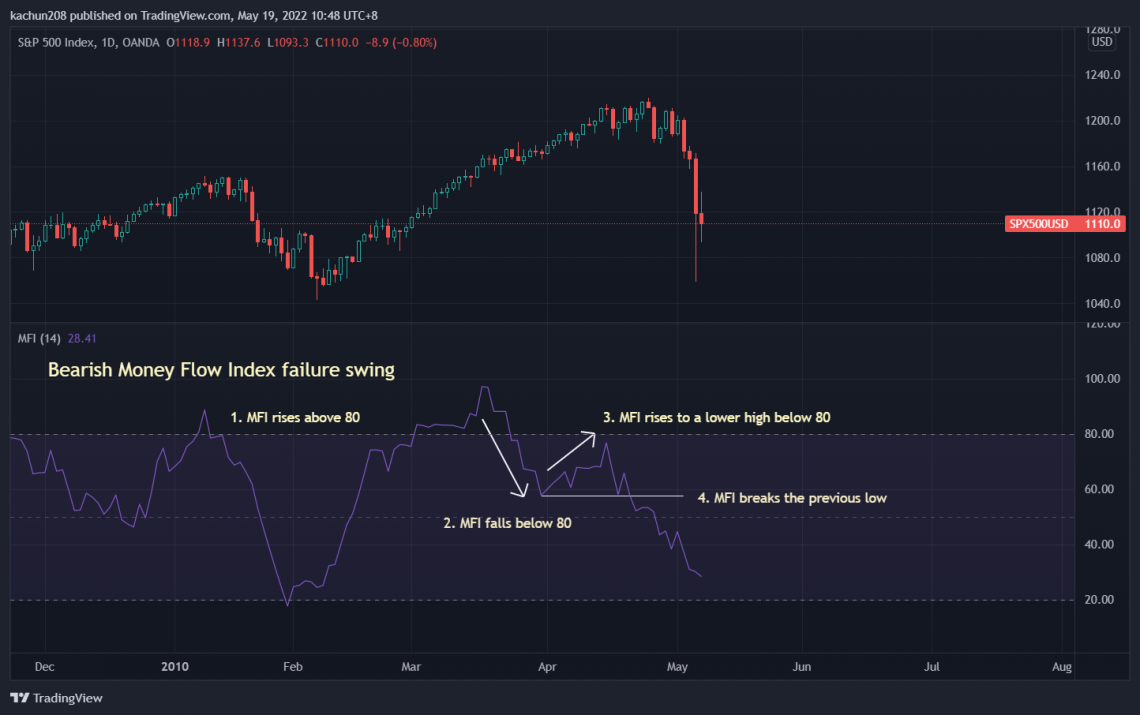
Step 1: The index rises above 80. (overbought)
Step 2: The index falls below 80
Step 3: It rises a little but remains below 80.
Step 4: It falls below its prior low
Is the Money Flow Index a good indicator?
The Money Flow Index is said to provide a holistic view of market momentum. But, like any tool, its effectiveness is rooted in its application.
MFI Is Proven An Effective Indicator
A research "Optimization and Testing of Money Flow Index" was conducted by Marek and Adková in 2020 to investigate several parameter settings. The testing was done at different time frames and with other firms (e.g., Apple, Exxon Mobile, IBM, Microsoft).
This research revealed that the indicator could outperform a simple buy-and-hold strategy, proving it helps trade. Yet, the study has shown the Money Flow indicator settings commonly advised in the paper provide no edge for trading and that settings must be optimized for each stock.
Which Is Better: RSI Or MFI?
According to the analysis "MFI Vs. RSI – Which One Makes More Money?" conducted by Joe Marwood in 2018, Marwood back-tested both indicators with historical stock data from Norgate Data.
After that, he conducted tests to compare the two indicators.
Between January 1, 2008, and January 1, 2018, the list below shows RSI buy signals with MFI buy calls on 10,000 US Russell stocks over a three-day holding period.
There are no commissions, and all entries and exits depend on the next day's open price.
Holding Period: 3 Days
With a 3-day holding period, MFI outperformed RSI by comparing both with different time frames: 2 bars, 4 bars, and 8 bars.
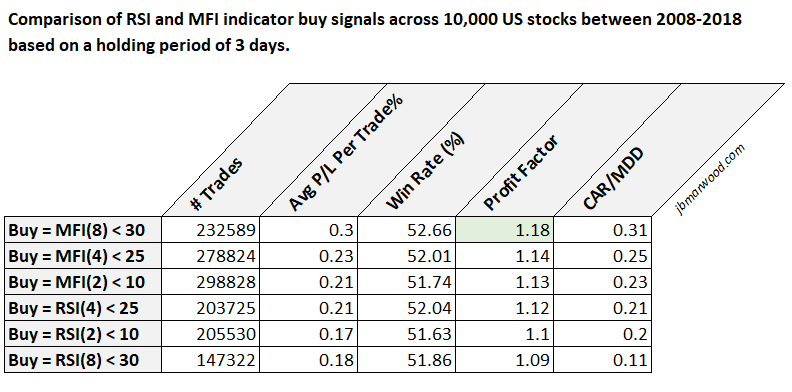
Given the results from the table above, the MFI signal outperformed the regular RSI over a three-day holding period.
From a broad sample of 232,589 transactions, the buy signal MFI(8) 30 generated the best returns, including an average profit of 0.3 percent per trade, a victory rate of 52.66 percent, and a profit factor of 1.18.
This result was better than the RSI(8) 30 buy signal, which yielded an average profit of 0.18 percent for each transaction and a profit factor of 1.09.
Holding Period: 5 Days
Over a five-day holding period, the table below summarizes RSI purchase indications to MFI buy signals:
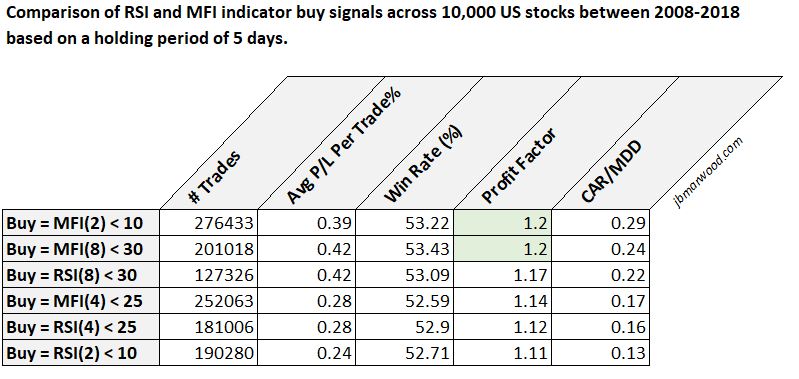
As you can see from the table above, the MFI indicator outperformed the regular RSI over a five-day holding period.
With an average profit of 0.39 percent per transaction, a success rate of 53.22 percent, and a profit factor of 1.20, the buy signal MFI(2) 10 delivered the best profits.
The buy signal RSI(2) 10 was inferior, yielding an average profit of 0.24 percent per transaction and a profit factor of 1.11.
Holding Period: 10 Days
The was repeated with a 10-day holding time because the 5-day holding period yielded some detailed results.
Due to an upward movement of stock prices, a 10-day holding period usually delivers better results:
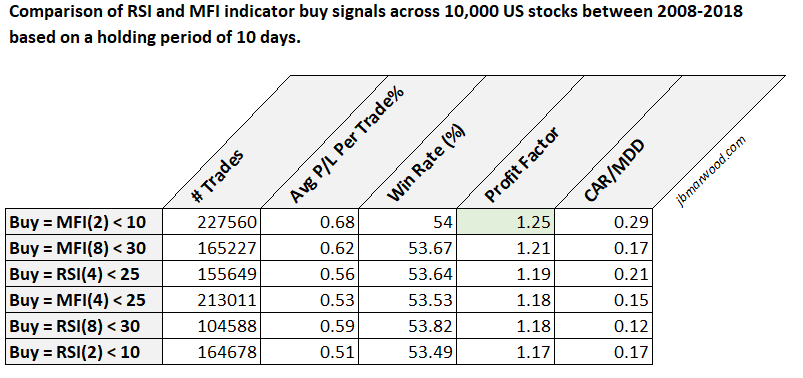
With a 10-day holding period, MFI again outperformed RSI.
Given the above, the Money Flow Index once again produced the most spectacular findings. MFI(2) and MFI(8) deliver a higher profit factor than the rest of the RSI performance.
With a success rate of 54 percent and a profit factor of 1.25, the buy signal MFI(2) 10 yielded an average profit of 0.68 percent per trade, being the most profitable indicator among other signals.
Although the RSI is a well-known technical indicator amongst traders, the MFI is largely underlooked. The Money Flow indicator is equally as excellent as, if not better than, the RSI at identifying oversold assets, as evidenced by the data.
These findings are supported by a comprehensive sample of transactions across ten years of data. In addition, to prevent survivorship bias, researchers included delisted stocks in the data to avoid only using data on the stocks still existing in the market.
The result shows that the MFI is just as effective as the RSI.
Advantages and Limitations of the Money Flow Index
This MIF Indicator, like other volume-based analytical tools, is a leading indicator, which means it may be used to forecast market moves.
The advantages are as follows:
- It is simple to set up: It is easy to set up the MFI indicator as it is provided with most trading platforms.
- It is simple to understand: MFI is simple to use for novices. First, you have to set up the indicators and follow their signals, such as when the market is overbought or oversold.
- It helps to identify possible trend reversals: It is consistent with tracking traditional price action and is better suited to spot reversals and failed signals than other oscillators.
- Divergences are more effective with the index, introducing volume to magnify the difference between trend strength and price perception.
The following are the disadvantages:
- It can send out erroneous signals: The index can send out erroneous signals. This occurs when the indicator shows a favorable trading opportunity exists, but the price does not move as expected, resulting in a losing trade.
- For example, a dispersion may not lead to a price reversal.
- It may miss crucial price movements: It's also possible that the indication will miss anything crucial. For instance, while a divergence may cause a price reversal in some cases, it will not be present in all price reversals.
- It's crucial to realize that indicators aren't always correct. As a result, they should indeed be utilized in combination with other types of analysis and connected with an appropriate risk management approach.
Money Flow Index trading strategies
Technical traders use a variety of trading tactics to generate trading signals by combining several indicators.
The Money Flow indicator is one of them, and it can be utilized in a variety of situations. Here are a few examples of them.
Trading Signals Using The Money Flow Index And 20 SMA
The average of a given range of prices, usually closing prices, divided by the number of periods in that range, is calculated by a simple moving average (SMA).
The simple moving average (20 SMA) is a 20-period moving average. When the price crosses the 20 SMA, it usually generates a trade signal. Confirming the signal using the money flow indicator improves the likelihood of correctly forecasting a trend reversal.
- Buy Signal: The price rises above the 20 SMA below, and the Money Flow Indicator rises above 40 simultaneously.
- Sell Signal: The price falls below the 20 SMA from above, and the Money Flow Indicator falls below 60.
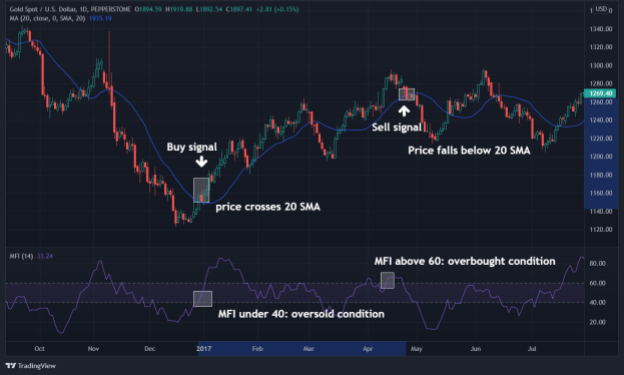
When the Money Flow indicator is below 40, indicating that the market is oversold, and the price crosses the 20 SMA, a buying signal is provided on the GOLD/USD chart. An entry is made at the day's closing price.
The Money Flow indicator is above 60, indicating that the market is overbought, and the price has crossed the 20 SMA, indicating a sell signal. An exit is made at the day's closing price at the end of the day.
Algorithmic Trading Money Flow Index And Python
Algorithmic trading is the program of planning orders using automated and pre-programmed trading instructions to account for variables such as price, timing, and volume. An algorithm is a set of rules for solving issues.
Python is one of the rising programming languages for algorithmic trading. Python's functional programming approach makes it easy to create and analyze Algo-trading mechanisms.
Money Flow indicators can be incorporated into algorithmic trading, and if you are interested, check out this article.
And here comes the tutorial video for setting MFI with Python:
Money Flow Index FAQs
Is a momentum indicator that measures both the volume and price within a given time.
The Money Flow indicator is similar to the Relative Strength Index (RSI), yet Money Flow Index factors in volume and is therefore also known as the volume-weighted Relative Strength Index.
There are three signals given by this index: overbought/oversold circumstances, failure swings, and divergences.
A change in the indicator’s value might imply a volume change that may indicate l a trend reversal. Combining other indicators like MACD and DMI could bring you a bigger picture.

Researched and authored by Ka Chun CHIU | LinkedIn
Free Resources
To continue learning and advancing your career, check out these additional helpful WSO resources:

or Want to Sign up with your social account?