Money Flow
A mathematical function that investors use to predict cross-sectional fluctuations in future returns.
Money flow is often seen as a technical indicator. However, security price movements are not an actual indicator. Instead, this leads to the construction of hands of the difference in trading volume of up and down movements.

Therefore, it helps traders interpret market movements regarding financial instrument prices and volumes. In addition, they can identify potential trading opportunities.
You can quickly calculate the MF of a trading day just by knowing the typical price and trading volume. Traders can compare past and present results to determine changes in value. This feature also helps to understand the risks and rewards of investing in global equities.
If today's price is higher than the previous day, it builds an uptrend. This shows a favorable and buyer-motivated market.
On the other hand, if the price for the day is lower than the previous day, this forms a bearish indicator. This means negative price behavior and a seller-led market.
However, the fact that prices do not fluctuate on both days means a market with no cash flow.
Like the price, the transaction volume helps determine the MF by multiplying the price. Its uptrend indicates a favorable market, and its downtrend indicates negative trading.
The formula for calculating cash flow (MF) is as follows:
MF = Typical Price x volume
Where,
Typical Price = (High + Low + Close)/3
Therefore,
MF = {(High + Low + Close)/3} x Volume
Global Money Flow
Financial institutions utilize global cash flow analysis to examine the combined cash flow of individuals and/or companies to obtain a more comprehensive picture of their capability to service the proposed debt.

Globalization may lower international economic inequality (as in the case of developing nations) and worsen local economic inequality (e.g., increase relative poverty in several advanced countries).
To understand alternative viewpoints on globalization and clarify its consequences on isolated communities most susceptible to equality and diversity, the network analysis of international economic integration generated by the movements of goods, money, people, and information is essential.
To further understand the global money movement, consider the example of the European stock market. Unfortunately, the European stock markets were not exhilarating for investors in the mid-1980s to invest.
It only saw a boom due to pension funds substantially invested in the market by the US and the UK. Pension funds have traditionally diversified their portfolios by investing in foreign markets.
As a result, traders could exchange money and other assets between marketplaces worldwide based on risk. The purpose was to allow prices to rise rather than purchase equities at a lower price.
Calculation
There are several steps for calculating the cash flow index. If you are doing it by hand, you should use a spreadsheet.
- Calculate typical prices for each of the most recent 14 periods.
- For each period, indicate whether the price is typically higher or lower than the previous period. This will tell you whether raw cash flow is positive or negative.
- Calculate the total cash flow by multiplying the typical price by the volume for that period. Use a negative or a positive number depending on the increment or decrement period (see step above).
- Calculate the cash flow ratio by adding all the positive cash flows for the past 14 periods and dividing them by the negative cash flows for the last 14 periods.
- Calculate the cash flow index (MFI) using the ratio found in step four. Continue to perform calculations at the end of each new period, using only the last 14 periods' data.


As said earlier, trading at a higher price indicates positive money flow and vice versa. So let's calculate the result for two days:
Previous Day
- High price = $68
- Low price = $60
- Closing price = $62.5
- Number of shares = 100,000
MF = typical price x volume
= {(Close + high + low) / 3} x Volume = {(68+60+62.5) / 3} x 100,000
= $6,416,666.67
Current Day
- High price = $70
- Low price = $75
- Closing price = $72
- Shares volume = 200,000
MF = typical price x volume
= {(Close + high + low) / 3} x Volume = {(70+75+72) / 3} x 200,000
= $14,466,666.67
The example above shows positive cash flow between the two dates. Hence, it shows a buyer-driven market scenario.
Real Flow
The actual flow occurs when goods and services move from one business sector to another. The basic flow is so-called because goods and services physically move between the two industries of households and businesses. Therefore, it is also called a product flow or a physical flow.

In the real world, the household sector owns the input services of the company in the form of goods, land, labor, capital, and business; in return, the company has the goods and services to meet the demands of the household.
Therefore, the real flow has the following format:
- The household sector provides the factor of production to the manufacturing sector.
- The actual flow of final products and services from producers (companies) to consumers (households).
In addition, it serves as a reward for the productive services that households provide to businesses. And thus, money plays no role in the actual flow, as bartering difficulties can occur.
Key Differences
There are two types of indirect inflow of income – Real Flow and Money Flow. In the case of real inflow, goods and services exchange occurs among colorful sectors of the economy. On the other hand, the financial exchange between the two sectors exists when we talk about cash inflow.

A two-sector economy is one where only two sectors live, i.e., the ménage sector, which represents the consumer group, and the patron sector, which represents enterprises.
Real and cash flows represent two sides of the coin, wherein the real inflow of goods and services is original to the same yet contrary to plutocrat inflow.
Hence, goods and services flow in one direction, and the financial payment for the mileage of these services flows in the rear direction.
Let us discuss the critical differences for a better understanding.
1. The actual flow includes the flow of essential services from the owner (household) to the producer (company) and the corresponding flow of goods and services from the producer (company) to the consumer (family).
Conversely, the flow of factor services generates factor income. Rent, wages, interest, and profits are generated from the company to the household, and there is a corresponding flow of consumption expenditure from the family to the company.
2. The actual flow is also called the physical flow because the precise movement of goods and services occurs between the household and the company.
In contrast, money flows are also called nominal flows because transactions are made using money as a medium of exchange.
3. In the actual flow, the movement of factor services, goods, and services is clockwise, but in the case of cash flow, the trends are reversed, and the flow is counterclockwise.
4. The actual flow includes the flow of production factors. Land, labor, capital, business, and business provide final products and services to meet consumer demand.

In contrast, in the case of cash flow, rent is paid by the company in the form of land rent, labor wages, interest on the capital employed, and the company's profits. In return, the consumer gives money for the goods and services purchased from the company.
5. In cash flow, money is used as a medium of exchange that facilitates transactions by monetary valuation.
In contrast, in the actual flow, money is not used as a medium of exchange but results in a physical flow of factors of production and goods and services. Therefore, the drawbacks of the barter system can emerge.
Indicators
Gene Quong and Avrum Soudak created the Cash Flow Index. The MFI is a leading indicator that uses price and volume to indicate whether prices are overbought or oversold. This indicator is usually positive when prices rise and negative when prices fall.
The best way to think about the MFI is to consider the RSI. Essentially, Gene and Avrum understood the importance of volume and how it affects the market. So they added mass to the MFI calculation.

Traders widely use Chaikin Cash Flow Oscillators to make more accurate exit and entry points decisions. Mark Chaikin's indicator uses volume and closing prices to demonstrate market volatility.
Traders often use the MFI to evaluate the price process and volume to discover overvalued and overestimated (overbought and oversold) levels. It is a cumulative total.
The MFI, like many other indices, becomes more comprehensive and compelling when taken in conjunction with others. Since the MFI produces early warning signals as a leading indicator, it is essential to use a confirmation indicator to minimize errors and other pitfalls.
MFIs are used in tandem with other technical indicators to mitigate false trading signals.
Let's go over the indicators mentioned above in more detail.
Money Flow Index
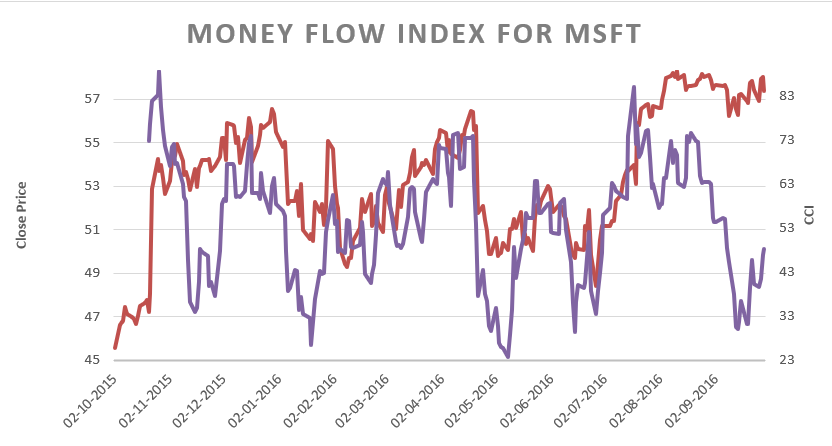
MFI) is one of the technical oscillators or momentum indicators used in transaction decisions. This helps traders to determine which money will enter or leave the asset during a particular time by calculating the transaction price and volume.

Using this data, traders can understand the possibility of overbuying (standard price increase) and oversell (typical price reduction) over a particular time. These trading pressure levels lie between 0 and 100.
Readings above 80 indicate overbought, and readings below 20 indicate oversold. Therefore, the data collected helps calculate the MF ratio, also known as the monetary ratio.
This cash flow index is similar to the Relative Strength Index (RSI). The former considers price and quantity-related information to create a reliable indicator, while the latter analyzes only the price. Traders can also use this to find differences that indicate changes in price trends.
Method
The MFI calculation considers the monetary ratio resulting from positive cash flows divided by negative cash flows.
MFI = 100 x {positive MF / (positive MF negative MF)}
or,
MFI = 100 - {100 / (1 money ratio)}
Where,
Money ratio = (Positive MF) / (Negative MF)
This is where MF expressions can help achieve both positive and negative results.

Advantages
- The MFI reading is based on the traditional strategies associated with the Relative Strength Index.
- When readings become overbought or oversold, traders can identify divergences beyond simple changes in market prices.
- These divergences are often used as the basis for reversal trading strategies, which is why adding volume metrics can benefit traders with various investment styles.
- Unlike most traditional oscillators used in technical analysis, the Money Flow Indicator incorporates changes in the flow of trades. This information allows traders to gauge market trends in a unique, time-based indicator.
Disadvantages
- At the same time, the Cash Flow Index sometimes generates false signals, leading to unexpected losses in specific market environments. For example, an MFI divergence does not necessarily translate into a market price reversal.
- Additionally, an overbought or oversold reading may not necessarily signal the end of a previous market trend.

For these reasons, professional traders are often advised to perform additional forms of technical analysis to confirm indicator indicators and control risk when the possibility of unexpected volatility increases.
Chaikin Money Flow
Chaikin Money Flow can be used with support and resistance if breakouts from these levels can be seen. Therefore, if the price breaks the resistance level while the CMF is at a higher peak during the uptrend, the trend will continue to rise.

On the other hand, if the price falls below the support level on the downtrend and the CMF hits a new low, we will see that the downtrend resumes.
Potential trend reversals can be identified by price behavior and possible divergence when the CMF moves in opposite directions.
A bullish divergence can occur if the price moves to a new low when the CMF is not following the same move. This indicates that an uptrend might form.
If, on the other hand, the CMF remains unchanged or even rises to a new peak while falling, a bearish divergence will occur, indicating the possibility of the start of a downtrend. As a result, volume traders often use CMF, which is not exceptionally reliable as a standalone indicator.
Therefore, this indicator should be combined with other technical analysis indicators to identify identified signals and create a Chaikin cash flow strategy.
Chaikin's money flow formula
Chaikin believed that where a period closes, it's high/low range could predict buying and selling pressures. If the period ends in the upper half of the range, buying pressure is higher; selling pressure is higher if it ends in the lower half of the range.

Chaikin calculates the money flow in three distinct steps:
Step 1
MF multiplier = {(close-low)-(high-close) / (high-low)}
Step 2
MF volume = MF multiplier x period volume
Step 3
CMF = MF Total 21 Periods of Volume / Total 21 Periods of Volume
Where 21 is the volume-weighted closing performance of the stock for one month and the standard trading days are usually 21 or 22 days for each month.
Advantages
- Spotting a New Trending Market: The CMF can be used to spot an emerging trend. For example, a rise above the zero line may indicate an emerging uptrend, while a drop below the zero line may indicate an emerging downtrend.
- Trend direction and strength confirmation: Traders often use the indicator to confirm trend direction. When the uptrend is strong, the CMF is mainly in the positive zone, and when the downtrend is strong, the needle is primarily in the negative location.
- Provides potential exit signals: The CMF indicator can form divergences, often indicating when a trend reversal is likely.

Disadvantages
- Not a Trading System: This indicator should not be used as a standalone indicator; it should be combined with other trading instruments.
- It is not a trade management tool: Although this indicator can sometimes show potential trend reversals, you cannot reliably use it to determine the stop loss and take profits because divergences don't happen all the time.
- Easy to get false signals: CMF can give false signals, especially when the market is in a range. False signs are more common on smaller time frames, so it's best not to use them on smaller time frames.
Key Takeaways
- Cash flow is a mathematical function that investors use to predict cross-sectional fluctuations in future returns.
- The Chaikin Cash Flow Oscillator is a standard cash flow indicator used by traders to make investment decisions.
- From a global perspective, cash flow helps us understand the risks and opportunities associated with international equity investments.
- The Money Flow Index (MFI) is a technical indicator that uses price and volume data to generate overbought or oversold signals.
- MFI readings above 80 are considered overbought, and MFI readings below 20 are considered oversold.
- Levels 90 and 10 are, nevertheless, utilized as thresholds. It is worth noting the distinction between indications and pricing. If the indicator increases while the price is declining or static, the price may rise.
- If the Chaikin cash flow indicator is red, it indicates that the market is on a downtrend, and if it is green, it shows an uptrend.


or Want to Sign up with your social account?