Excel Modeling Best Practices
Guidelines for building the best Excel models


Excel is a powerful tool for modeling data. The general idea behind using Excel for financial modeling is that it is an excellent software to manipulate numbers to forecast future values and revenues, project cash flows, calculate fixed and variable costs for a business model, etc.

Professionals use it to build financial models that help better understand the relationships between countless variables and answer some of the most challenging questions in investment research and decision-making.
Obviously, a model's output is only as good as the work that goes into it. Recent Excel research by Acuity Training shows that 98% of office workers have seen an error in a spreadsheet that cost their employer's money, so it goes without saying that they need to be built with care.
With some time and practice, you too can use Excel to monitor:
- Investments
- Optimize prices
- Generate forecasts
- Perform sensitivity analysis
It is a good idea to follow best practices when modeling in Excel, as it will help you build your model quickly, accurately, and reliably. You might have heard some of them before:
- “You need to be careful not to enter data in the wrong sheet or create formulas with errors.”
- “Be sure not to mix cell references when copying cells.”
- “Always keep your workbook updated, so you don’t have errors while trying to share your workbook with others.”
The scope of these best practices goes far beyond.
Excel modeling comes with something called model risk. It is the risk that arises due to potential errors in the models or their inappropriate usage or implementation and is inherent in all sophisticated quantitative models to some extent.
It can lead to considerable losses, poor decisions, and reputational damage.
Most of this risk can be alleviated if the modelers and users have advanced modeling know-how and if the models are independently audited. However, that is not something on which we can always rely.
Each model should be built for various users with varying levels of experience.
In this article, we will explore these best practices so that you can make sure to avoid common pitfalls when building your model!
- Excel is a powerful tool for financial modeling, but it requires careful planning and organization to avoid errors and maximize effectiveness.
- Clearly define the objectives of your model and create a blueprint before starting. This helps maintain integrity and reduces the risk of structural changes later.
- Keep the model simple and avoid unnecessary complexity. Use consistent formatting and protect cells to ensure data integrity.
- Use built-in Excel functions like IFERROR, XLOOKUP, XNPV, and XIRR to handle errors and improve accuracy.
- Conduct independent reviews, include error checks, and provide clear documentation to enhance the transparency and reliability of your financial models.

Planning
The development of all complex things starts with planning. The first step to building a model is creating a blueprint on which it will be based. Structural changes halfway through the modeling assignment can threaten the model’s integrity. It can also be time-consuming and confusing and may even increase model risk.
The chances of facing these unwanted challenges increase when modelers are not the same as users. However, these circumstances can be easily mitigated by allocating some time to planning at the start.
Finance experts recommend that the planning phases follow the given steps:
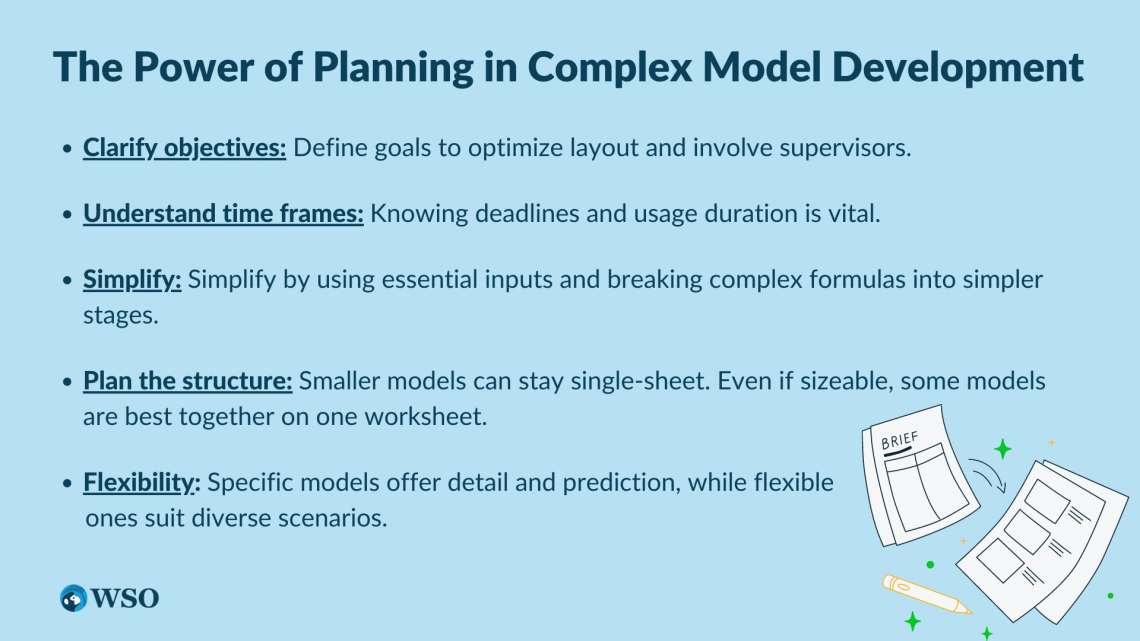
1. Clarify objectives
Modelers must be clear on the aim of the assignment. If the modelers are not aware of the objective, they cannot build an effective model.

The key to optimizing a model’s layout, structure, and outputs is clearly defining the objectives. Developers must keep their supervisors in the loop when making the model’s blueprint, so the supervisors to suggest necessary changes before much work has been done on the model.
If model development is started while the blueprint is not agreed upon, the modelers might need to start from scratch later if it is found that the blueprint isn’t okay.
2. Understand time frames
Although slightly less critical than understanding the objectives, it is crucial to know the deadlines for building a model and the tenure for which it will be used. Often, templates are more suitable for quicker solutions with less case-specific reusability.

Templates offer speedy solutions with minimal chances of error. They also tend to be easier to use.
On the other hand, models with longer expected tenures are built from scratch. This is because an exceptional amount of work goes into making them as they are built to be flexible and detailed.
3. Simplify
Modelers must try not to overcomplicate things. It can certainly be tempting to add innumerable inputs and assumptions to increase the model’s predictive power. However, that is not a good idea.
The more information and assumptions a model has, the higher its complexity. Instead, modelers must ascertain the minimum number of inputs and outputs necessary to fulfill the objectives.
Modelers should also avoid complex formulas by breaking them into more uncomplicated steps. Although this will create more rows and thus more extensive spreadsheets, it makes it easier for other users to follow and audit the model effectively.
4. Plan the structure
Some financial models are small and may not need to be split over multiple worksheets, and keeping some models on the same worksheet might be recommended even though they might be large chunks of numbers.
However, often, data needs to be organized over multiple sheets, segregated into inputs, calculations, and outputs.
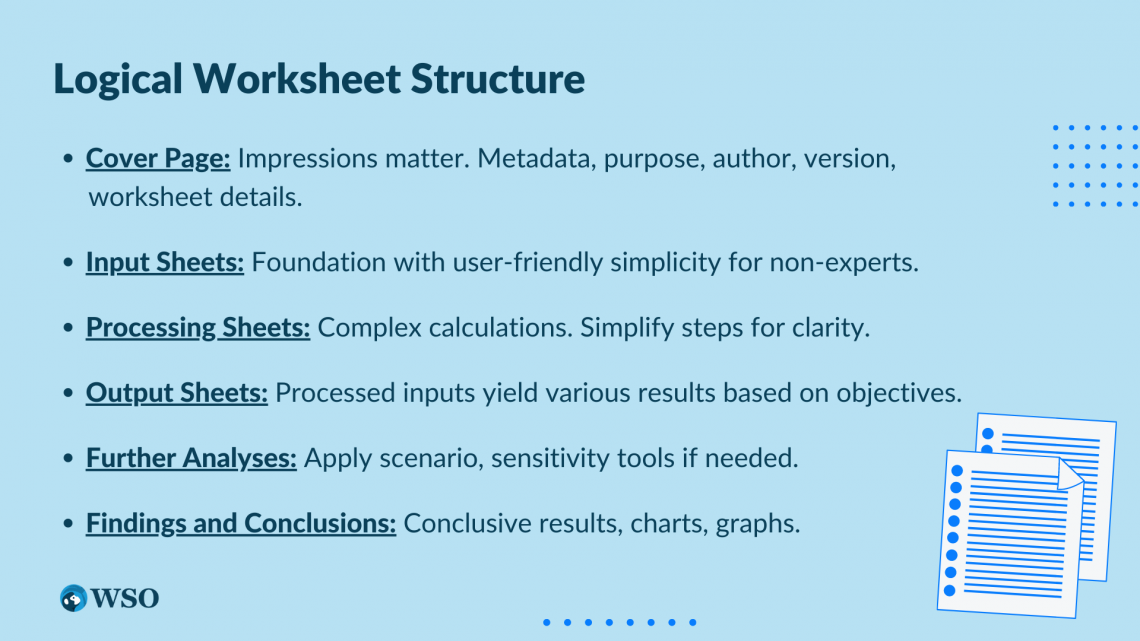
Logically structuring the worksheets enables users to quickly understand the models, use them, and audit them. Therefore, it is suggested that models be structured into layers in the order given below.
- Cover page: It is the key to making an excellent first impression. It includes the model’s metadata – its purpose, author’s name, version details, details of each worksheet, etc.
- Input sheets: These include all the input and assumptions that form the base of a model. These must have a simple structure as people using them may lack modeling know-how.
- Processing sheets: These worksheets generally carry complex formulas and calculations that process the inputs into outputs. To ensure ease of use and transparency, complicated computations in these sheets must be broken down into more uncomplicated steps. The cover page may indicate that these sheets be left untouched due to their complex nature.
- Output sheets: The input data and assumptions in the input sheets are processed in the processing sheets to form output which is further projected on these output sheets. Depending on the modeling objective, the result can take many forms.
- Further analyses: If necessary, the output data may be further analyzed using scenario analysis, sensitivity analyses, and other tools.
- Findings and conclusions: These sheets may contain the results and conclusions based on the entire modeling exercise. Ideally, the data should be presented with the help of charts and graphs. These sheets may also include an executive summary.
5. Flexibility
It is necessary to consider the flexibility requirements of models before developing them. The number of inputs and assumptions depends on the flexibility requirements.

A model built for a specific purpose need not have as much flexibility as a model made for varying situations. The former can have a higher level of detail, enhancing its predictive power.
However, it may suffer from overfitting. On the other hand, the latter would be made to fit in varying situations and may suffer from underfitting.
Speaking of “flexible,” did you know that WSO offers a variety of flexible templates for free? They range all the way from investment banking modeling templates to cover letter templates.
In addition, they are plug-and-play which means you can start entering your own numbers right after you download them and experimenting with them all you want. So, sign up below to receive them in your inbox!
Excel modeling best practices
Below are some essential best practices to follow while building your financial models in Excel.
Workbook
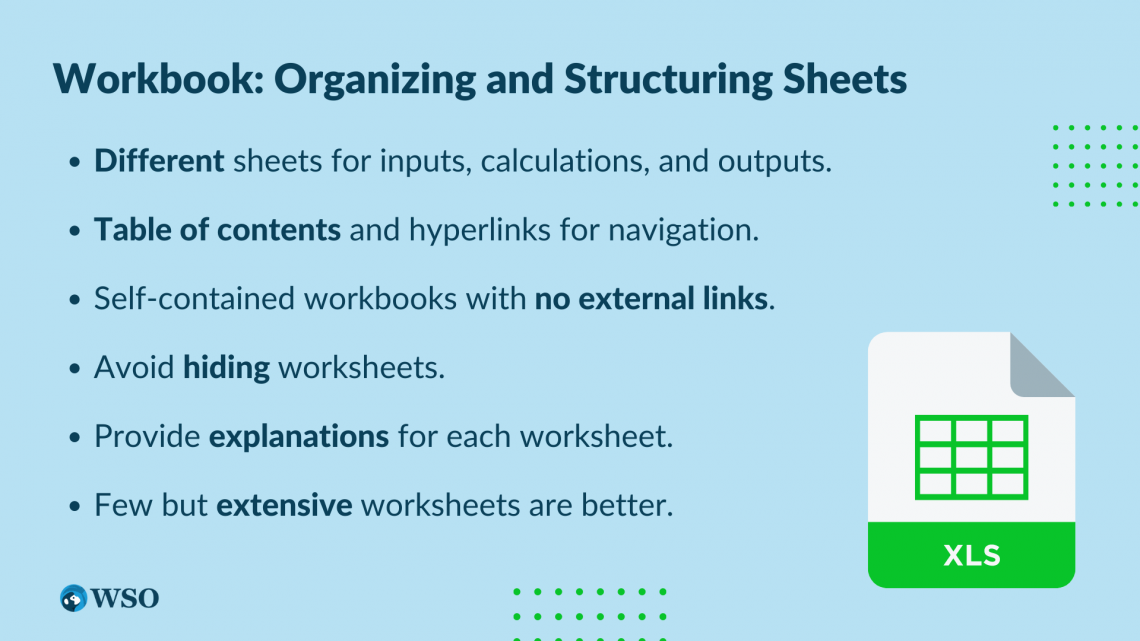
- Maintain different sheets for inputs, calculations, and outputs. Each worksheet may be color-coded by its type to aid in identification.
- A table of content for each sheet and each section provides users with a slightly detailed overview, and adding hyperlinks in tables can make for more straightforward navigation.
- Ideally, workbooks should not have any external links and should be self-contained.
- Avoid hiding worksheets as that may confuse users.
- Workbooks should include a brief explanation of each worksheet and its essential sections.
- Few but more extensive worksheets are easier to build and maintain rather than many smaller worksheets.
Worksheet
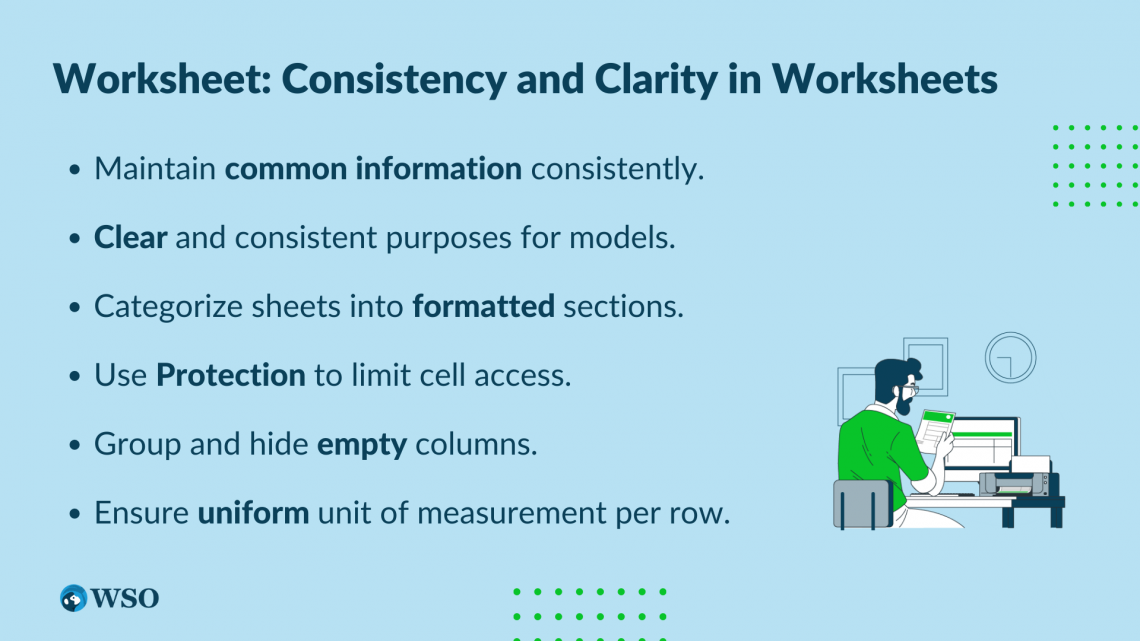
- Maintaining common information in the same location on every worksheet aids comprehension and provides inconsistency. These items may include title, navigation, and error checks.
- Assign clear and consistent purposes to models.
- Categorize sheets into sections with headings that are consistently formatted to distinguish differences.
- Use the Protection function to prohibit access to cells that should not be changed. This decreases the risk of accidental errors as users can only change inputs in the input worksheets.
- Group and hide empty columns.
- Each row should have values with the same unit of measurement.
Input
- Limit input cells to input worksheets. Output sheets must only have input cells that relate to output controls.
- Data Validation can be used to limit the input parameters to valid values.
- Label inputs appropriately.
- When using external links, entering data as static inputs removes the risks associated with those references.
Formatting
- A formatting key helps users differentiate between different cells and, thus, should be prominently displayed in the model. For instance, cells with formulas may be formatted differently from cells with hardcoded inputs.
- Enter all inputs once only. If an input needs to be placed in multiple cells, link them to one cell. If an input needs to be changed later, it will need to be changed in one location only.
- Consistently applying formats helps identify and avoid calculation issues and ensures uniformity.
- When working on output sheets, modelers need not adhere to the formatting rules applied in the other sheets, as these sheets must be visually appealing to the stakeholders.
- Format the bottom row of the content on each worksheet.
- Format key outputs consistently, such as totals and subtotals.
- Except on output worksheets, use fonts sparingly.
- Note or explain complex bits using comments.
- Avoid merging cells to decrease model risk. “Center across selection” is a great substitute.
Toolbar Functions
Excel offers plenty of built-in functions that help modelers protect the model’s integrity. Most of these functions can be accessed from the various tabs on the menu ribbon.
A few of those helpful functions are listed below.
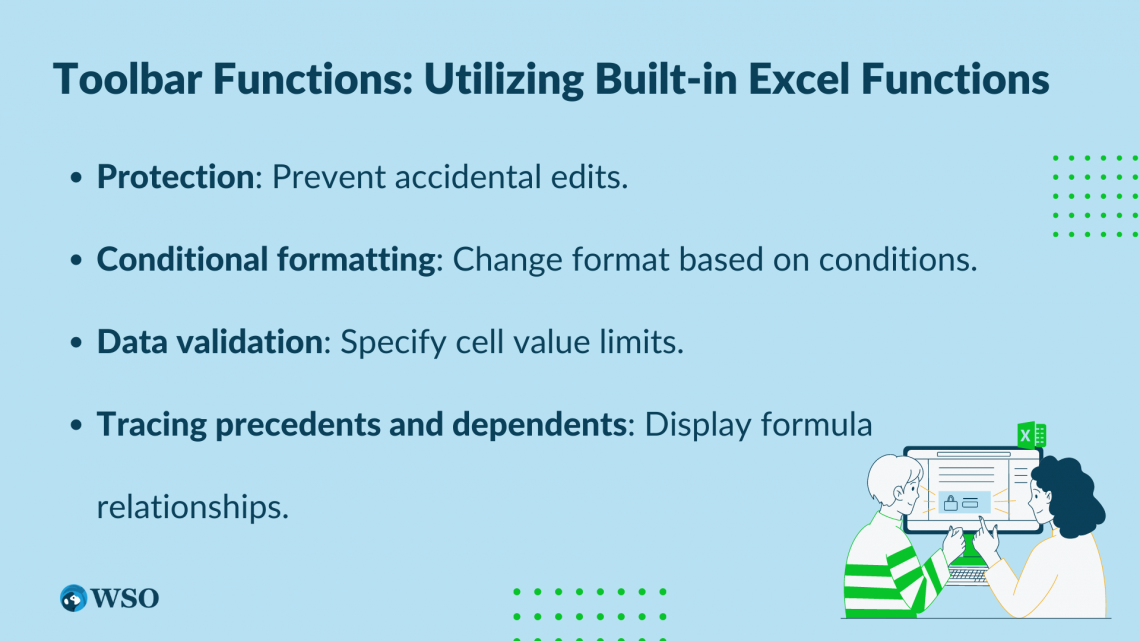
1. Protection
This tool prevents the data from accidental or deliberate edits. Modelers can lock the desired cells and then password protect the worksheet. In addition, they can also prevent others from seeing formulas or working inside/outside specified ranges of cells.
The Protect Sheet and Protect Workbook features can be accessed from the Review tab on the ribbon.
For more information on this, please check out this guide from Microsoft.
2. Conditional formatting
As the name suggests, this tool changes the formatting of cells based on some prespecified conditions. It can be found in the Style group on the Home tab on the ribbon. Green, yellow, and red are the most used colors for conditional formatting.
These visual aids allow users to differentiate between data quickly. For instance, the sales growth rate may be conditionally formatted to have red fill color if the rate is negative, yellow when it is close to zero, and green when it is positive.
3. Data validation
This tool allows modelers to specify what values a cell can or cannot accept. It can be found in the Data Tools group on the Data tab on the ribbon. If you use the Mac version of Excel, you can find it in the Data menu in the menu bar at the top.
4. Tracing precedents and dependents
Trace Precedents and Trace Dependents are in-built tools in Excel that allow modelers to graphically display the relationships between formulas and precedent/dependent cells with tracing arrows.
This tool can be accessed from the Formulas tab on the ribbon. For detailed instructions, please see this guide from Microsoft.
Formulas
Like the functions seen above, Excel also offers some formulas to ensure data integrity. However, formulas are not accessed from the ribbon but by entering them in cells on the worksheet.
Financial modelers will commonly see these formulas listed here.
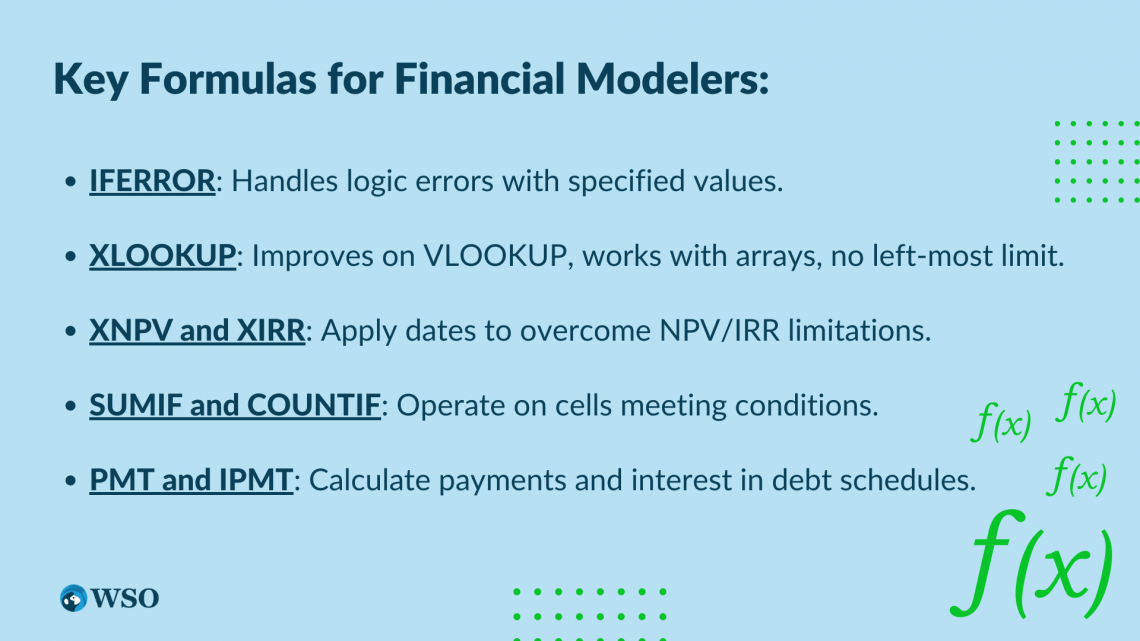
1. IFERROR
Modelers should use this function to keep the model free of logic errors such as “#REF!”, “#DIV/0!” and “#NUM!” It is used to trap and handle these errors. The formula returns a specified value if the result of a formula is a logical error.
This ensures that all dependent cells can use some default values instead of failing due to the errors in the precedent cell.
2. XLOOKUP
Nested IF formulas can be hard to track after a few levels of nesting. Instead, users should use the more helpful VLOOKUP. It is one of the most used functions in Excel. Since its introduction in 2019, XLOOKUP has been dubbed as the successor to the popular VLOOKUP and HLOOKUP functions.
XLOOKUP addresses some of the limitations of VLOOKUP.
While VLOOKUP only allows users to find cells, XLOOKUP lets users look for arrays of data. Furthermore, the former required the lookup column to be the left-most column, so users could not look to the left of the lookup column. The latter does not have this limitation.
3. XNPV and XIRR
Excel’s NPV and IRR formulas assume equal time between cash flows, which is often not the case in real life. The XNPV and XIRR formulas allow analysts to apply specific dates to cash flows to overcome this limitation.
4. SUMIF and COUNTIF
Considered advanced formulas, these operate on cells if they meet a given condition.
5. PMT and IPMT
These formulas can commonly be used in debt schedules. The former calculates the equal payments to be paid throughout the loan period, and the latter calculates the interest component included in these payments.
Other commonly used formulas such as IF, AND, OR, OFFSET, CHOOSE, CELL, LEFT, MID, RIGHT, LEN, TRIM, and CONCATENATE may seem to do simple things at first glance but are sophisticated formulas that can be combined to perform complex tasks. They are extensively used when cleaning the data.
Other considerations for formulas include:
- Formulas must be consistent across columns.
- Break longer formulae into smaller parts to make them easy to understand. A general rule of thumb is that they should be explainable in 30 seconds or less. Lengthier formulas may be noted in English or another language using comments and notes to aid understandability.
- Replacing user-defined formulas can be more efficient than long formulas, as it makes it easier to read, maintain, reuse, and document the formulas.
- Use only one formula in a row and copy it across.
- Formulas should refer to the values in cells to the left and above of the active cell since spreadsheets are generally read from top to bottom and left to right.
- Using range names makes formulas more readable.
- Use conditional formatting along with error traps to indicate if errors exist.
- Use the Delete key to clear cells, not the spacebar. This will avoid errors when referring to the cell.
- Use the SUBTOTAL formula instead of the SUM formula to make maintenance easier.
- Avoid copying formulas including named ranges from one sheet to another, as it creates hidden links between the worksheets.
- As defaults, enable automatic calculations and disable iterative calculations. You can find more information on this on Microsoft’s webpage.
- Avoid circularity.
- Ensure that formulas do not have hardcoded numbers.
- Avoid referencing empty cells.
- Use spaces in formulas to enhance readability.
- Always link to the primary source instead of daisy-chaining (creating chains of links).
Checks
It is important to have error checks to know right when an error occurs, which helps users avoid it at the earliest.
- Have a column in every worksheet that summarizes the error checks on it.
- In the frozen panes, include a cell in each worksheet that indicates the status of the error checks on it.
- Build a section in each workbook dedicated to “sense checks.” Sense checks are rules of thumb that indicate when the values of parameters are outside their normal ranges.
- Use conditional formatting with error and sense checks to be alerted when these checks are triggered.
Comments
- Use comments wherever necessary. They can help users understand the model better.
- Incorporate columns for sources and responsibility in the model. Their locations may differ based on the model requirements and objectives.
- Source columns on the input sheets should point out all the data sources and have hyperlinks to the originals.
- The content of the workbook may be noted on the cover page.
External links
- Error checks must accompany external links to indicate whether the source and destination locations are valid.
- Multiple external links must be organized with a consistent layout in one section on the input sheets or a separate input sheet altogether to reduce model risk.
- When linking time series data, the time series labels in the active workbook must be consistent with the ones in the external workbooks.
Review
- Review models before finalizing them. The review process must be documented.
- The documentation should include the review steps for each section.
- Reviews should also ensure adherence to best practices and modeling guidelines.
- Reviews should be independent as modelers may not find their own errors.
Other considerations
- Include a user guide in the model.
- Models must be appropriately documented.
- Include a diagram of the structure of the model in the workbook to give context. Include hyperlinks for ease of navigation.
- Limit the use of add-ins or additional software.

Free Resources
To continue your journey towards becoming an Excel wizard, check out these additional helpful WSO resources.


or Want to Sign up with your social account?