What is Financial Modeling?
The process of predicting and analyzing the company’s future performance, generally through spreadsheet software like Microsoft Excel.


What Is Financial Modeling?
Financial modeling is the process of predicting and analyzing the company’s future performance, generally through spreadsheet software like Microsoft Excel.
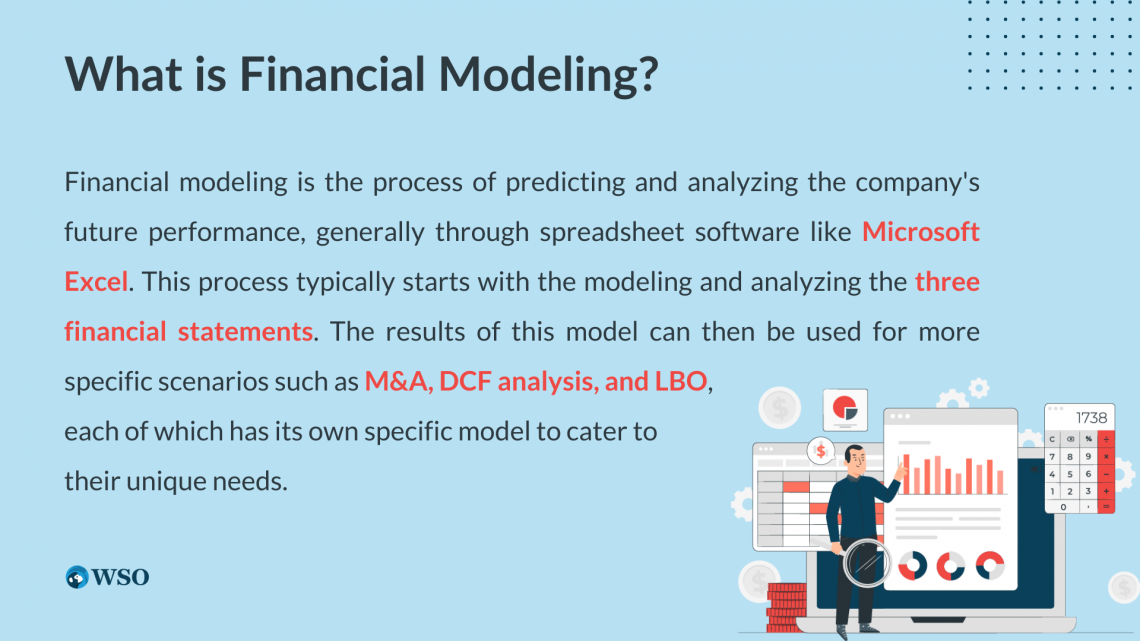
This process typically starts with modeling and analyzing the three financial statements (balance sheet, income statement, and cash flow statement), which is also referred to as the “3 statement financial model”.
The results of this model can then be used for more specific scenarios such as Mergers & Acquisitions (M&A), discounted cash flow (DCF) analysis, and leveraged-buyout (LBO), each of which has its own specific model to cater to their unique needs.
Financial modeling is also used to refer to the creation of abstract representations of real-world financial situations known as quantitative finance, with the modelers referred to as quantitative analysts or “quants.” The result is a mathematical model representing the performance of a business portfolio, financial security, project, or any other investment.
Financial models are regarded as tools used to make predictions about future possibilities or to assess the current situation of an organization so that management can decide on how to progress the business further.
Financial modeling in accounting or corporate finance (management accounting, financial accounting, treasury, etc.) involves using available information to analyze or predict a business’s performance, while quantitative finance is about translating a set of hypotheses on the behavior of markets into actionable numerical predictions.
- Financial modeling involves building abstract representations of real-world financial situations. These models help in forecasting future financial performance based on historical data and assumptions.
- Financial models aid in making strategic business decisions, such as mergers and acquisitions, fundraising, budgeting, and financial planning.
- It encompasses various types of models, tools, and best practices and has wide applications across corporate finance, investment banking, equity research, private equity, and project finance.
- Excel is the most common tool for financial modeling due to its flexibility and extensive range of functions. Other softwares, such as MATLAB, R, Python, Quantrix, and Crystal Ball, offers advanced capabilities for complex models.
Financial modeling: Why is it useful?
Financial modeling is a highly desired skill because it is a core component of the decision-making process in large organizations. The reason for this is that it can be used to provide a comprehensive understanding of the profitability of implementing decisions and risks associated with such choices (both in the present and the future).
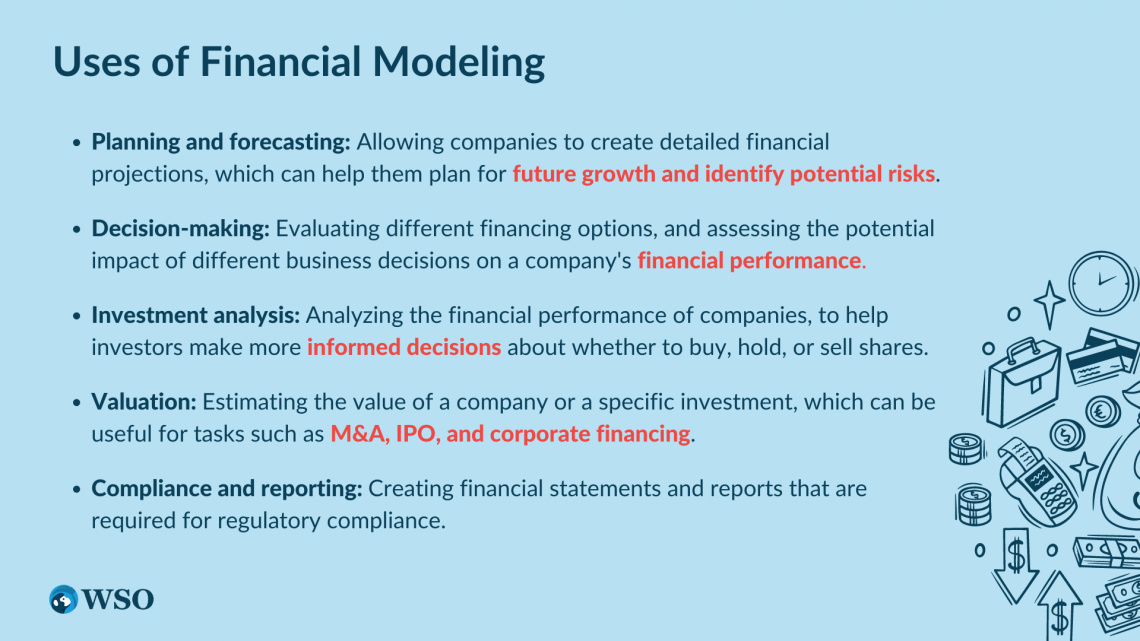
Financial modeling has many use cases for forecasting a business’ future economic performance and aiding with decision-making within the company. These include but are not limited to:
- Valuation of businesses or stocks
- Purchasing and selling assets or making acquisitions
- Cash flow and revenue forecasting
- Management Accounting
- Scenario planning and management decision-making
- Allocation or raising of capital
- Capital budgeting
- Pitch books
Uses of Financial Modeling
In business and finance, models serve a wide range of purposes, such as those listed below.
Capital markets
Analysts may use models to determine changes in capital market expectations, such as expected market returns in equity markets, or bond yields, depending on changes in interest rates.
Changes in expectations can affect capital asset evaluation. In addition, individual and institutional investors may use it to make strategic and tactical asset allocation decisions.
Valuations
Decision-makers may like to know the intrinsic value of their assets in absolute terms using DCF analysis or in comparison to similar assets. Valuation is not limited to businesses only.
It can be performed for any kind of return-generating asset, such as timberland, real estate, private equity, etc. However, it excludes assets like art, as they normally do not generate fixed cash flows, and their valuation is highly subjective.
Corporate Actions
Financial modeling may be integral to making decisions about corporate actions such as mergers and acquisitions. Knowing how much value can be generated by such corporate actions is important for assessing their viability.
Mergers and Acquisition models, also known as Accretion-Dilution models, answer questions such as:
- Is the transaction being fairly priced?
- Does the acquisition have synergistic value?
- Will the acquirer be issuing stock to acquire the target, or will it use cash?
Operations
Operations modeling can help improve the efficiency of any business's day-to-day operations. It begins with analyzing a business or division’s current operating model, assessing its implementation and performance, and reconciling organizational objectives and operations.
Businesses with robust operational models adapt better to changing business environments and, therefore, have higher survival rates.
They also tend to be cost-effective. Operational modeling may boost business efficiency in areas such as working capital management, human resources management, sales forecasting, market research, and forecasting.
Risk Management
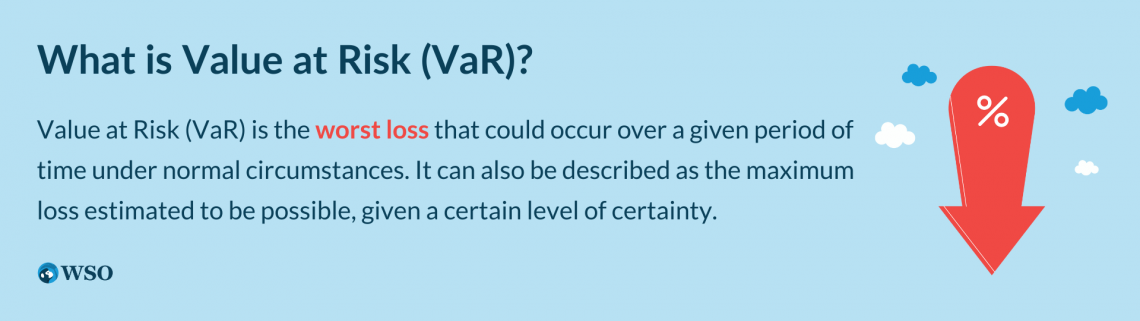
Financial risk modeling is one among many items that fall under the broad umbrella term “financial modeling.” It refers to estimating the various risks that are faced by a portfolio.
It uses several risk measures like Value at Risk (VaR), market risk, or extreme value theory (EVT) to evaluate portfolios and forecast the likelihood of losses. Financial risks can generally be grouped into the model, market, liquidity, credit, and operational risk.
Financial modeling: How to?
Modeling financial data is a difficult skill to master that contains many steps with varying levels of difficulty and detail. However, with the right structure and procedure in place, one can become more efficient at performing the task.
Before we go through all these steps, here is a short video demonstrating a basic financial model with a simple income statement whilst also highlighting how learning keyboard shortcuts and other skills in Excel will make your life much easier when performing the task:
Of course, there are many more steps than shown in the video, listed below with brief overviews.
1. Understanding the company and its industry to make the correct assumptions
This step involves inspecting and recording the company’s historical results, usually from financial statements of the past three years, into your Excel sheet. You can then use the assumptions for the historical period to make calculations on various aspects, such as variable costs, revenue growth, and gross margins, to test the accuracy of these assumptions.
For instance, if revenue growth has been increasing by 1% per year for the past three years and the industry is also growing in the foreseeable future, then one can assume that this growth rate will remain the same for the next few years.
Additionally, industry analysis reports are essential sources of information that help understand the dynamics of the industry in which the company operates.
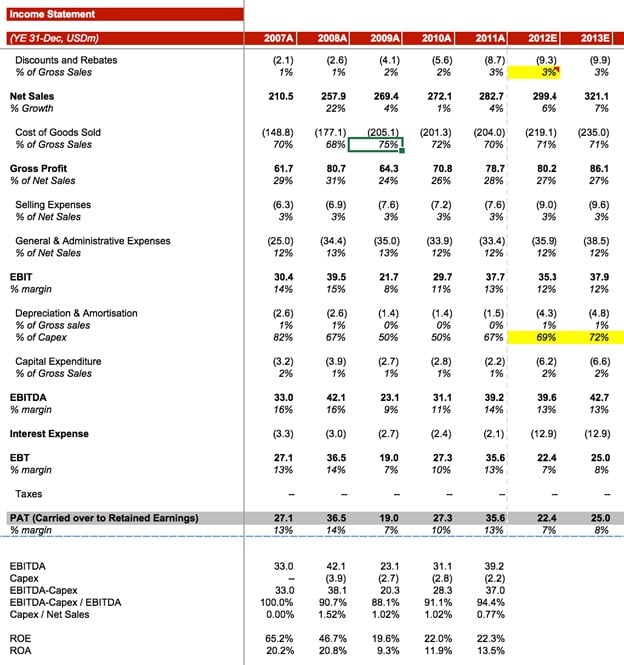
2. Start building the income statement
The next step is to fill out the income statement by calculating net revenue, cost of goods sold (COGS), gross profit, operating expenses, and operating income to arrive at earnings before interest, tax, depreciation, and amortization (EBITDA). Other elements like interest, taxes, depreciation, and amortization are calculated later using the supporting schedules.
3. Prepare the supporting schedules
A few supporting schedules need to be made, such as the fixed asset schedule (for assets like buildings, machinery, and vehicles), which you can find for free on our template page under the investment banking subheading. These schedules have to be prepared depending on the nature of the specific case. For instance, it would not make sense to use the inventory reserve schedule for a company that sells services and does not deal with inventory.
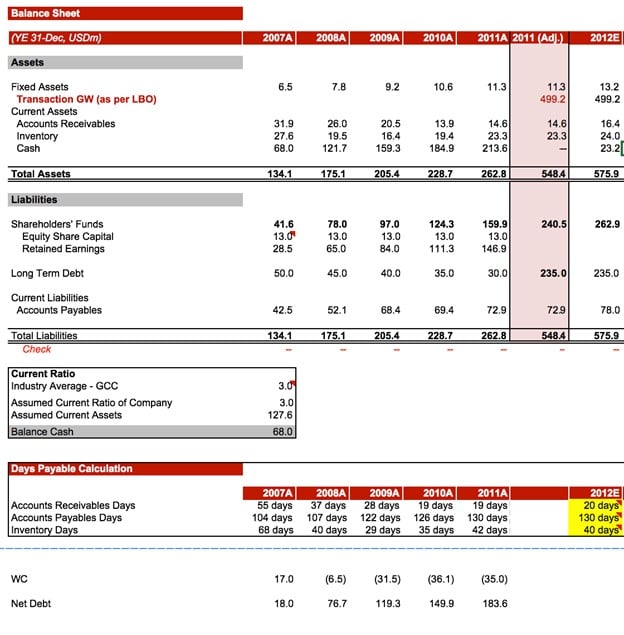
4. Complete the balance sheet and income statement
While you could have built part of the balance sheet before preparing the supporting schedules, working on the schedules first allows you to complete the balance sheet all at once.
\(x = {-b \pm \sqrt{b^2-4ac} \over 2a}\)
The information from the supporting schedules will aid you in completing both financial statements (income statement and balance sheet). The income statement can be completed after linking depreciation, tax, and interest to their respective schedules. This process is repeated for the balance sheet for the appropriate items like working capital and fixed asset schedules.
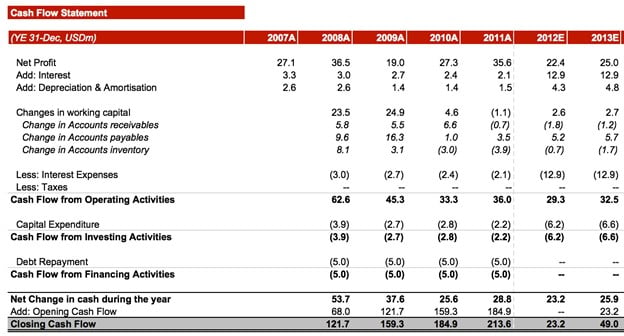
5. Build the cash flow statement
Using the information produced from the previous steps, you can now build out the cash flow statement, which primarily consists of inserting the correct formulae and linking the last two statements.
Once this is done, the Cash and Bank balance on the cash flow statement can be linked to the Cash Balance item on the balance sheet, the concluding step of the “3 statement financial model”. WSO provides an example of a completed version on our page, 3 Statement Financial Model - Template, and many other templates you can find on our template page, where you can download a wide variety of templates to address most of your requirements.
Further, we offer a course that goes in-depth into building the three-statement model from scratch. Below is a demo video from the course illustrating the linking of cash flows to the three statements. Please consider checking out our financial statement modeling course designed to give you unparalleled modeling skills in this first stage of building financial models.
6. Perform DCF analysis
After finalizing the three statement model, the next step is to perform a business valuation analysis using the discounted cash flow method. We also offer a course on DCF Modeling with over 75 lessons and a DCF model training free guide. Below is a video outlining the course objectives to give you an idea of what you can get out of the course:
7. Perform sensitivity analysis and check scenarios
Using the free cash flow amounts that we calculated previously for valuation, we can run different scenarios through sensitivity analysis by changing the earlier assumptions. These can be substituted with more optimistic or pessimistic assumptions to see how the valuation reacts.
This method of testing factors is called sensitivity analysis (or reasonability check) because small changes in the assumptions lead to significant deviations in the result of the valuation. This indicates that the valuation is extremely sensitive and reliant on the data from the assumptions.
It also helps the financial model users assess a range of possible scenarios, from worst-case to best-case. For example, if revenue growth is not as high as forecasted, the investment could start losing its appeal in terms of the benefits offered rather than the risks involved.
8. Ratio analysis
Financial ratios are calculated to summarise some of the information from the three statements, simplifying investors’ decision-making process. Many financial ratios exist, such as liquidity ratios, profitability ratios, leverage ratios, etc. These can be included within the income statement model, just like the template below.
9. Insert charts and graphs
In addition to trading ratios to summarize and facilitate understanding of the information for investors, visuals like charts and graphs allow us to communicate our findings transparently. In addition to being easier to understand than blocks of numbers and texts, graphs and charts are also time-efficient as one can take a glance at them and understand the general direction of results.
For instance, a graph with the title “share price” and a steep upward-sloping trend would signify to the person viewing the model that the business has high potential (this is a simple example, please don’t show the share price to the moon unless backed by actual research).
One should not base important decisions, like investing in a company, solely on charts and graphs. However, it is important to note that they provide an excellent, concise summary of the model and help your financial model stand out from others.
10. Review, stress test, and audit the model
Similar to sensitivity analysis, this step requires you to provide your model with scenarios. The difference here is that the scenarios provided would be extreme examples to see if the results are still accurate and the model behaves as expected.
Linking this to the recent COVID-19 pandemic, an extremely unexpected tail event in 2019, performing a stress test with a similar scenario could have prepared organizations for it.
If you would like to learn more about creating financial models, please check out our vast array of courses covering many finance topics. There are also online competitions that allow you to practice these skills once you have learned them. Here is a video on the equity schedule to give you a glimpse into what our modeling course entails.
Financial modeling: Best practices
Since many professions require this skill, there are some best practices to ensure that all models are standardized for their appearance and usability. Following these guidelines also helps speed up the review and audit process while enhancing maintainability. In terms of color coding, there are two primary colors (blue and black) to incorporate into your model. However, other colors further improve the accessibility of the model. The definition of these colors are:
- Blue for hard-coded numbers like inputs and assumptions
- Black for formulas and calculations
- Green for links to other worksheets within a workbook (the actual Excel file)
- Red for links to other files
- Dark red for links to data providers
Note: Keep in mind that these are the most widely used, but if your organization has its own modeling colors, make sure to use them. Adding comments (using Shift + F2 on the desired cell) is very useful to anyone going through your model to review or audit, acting as footnotes to explain why certain features were used, what the formula used means or to clarify any other detail. The financial model needs to use an easy-to-follow structure to enhance usability and understandability. The general structure of a financial model is as follows:
- Assumptions
- Income statement
- Balance sheet
- Cash flow statement
- Supporting schedules
- Valuation (using a specific model like DCF, LBO, etc.)
- Sensitivity analysis
- Graphs and charts
Other best practices include:
- Performing error checks throughout the workbook to ensure that all the figures are correctly matched and calculated (e.g., ensuring that Assets = Liabilities + Equity).
- Having a logical flow from left to right for the worksheets (following the structure provided can help with this) and within worksheets, such as starting with assumptions/inputs, then moving on to calculations, and finally output/results.
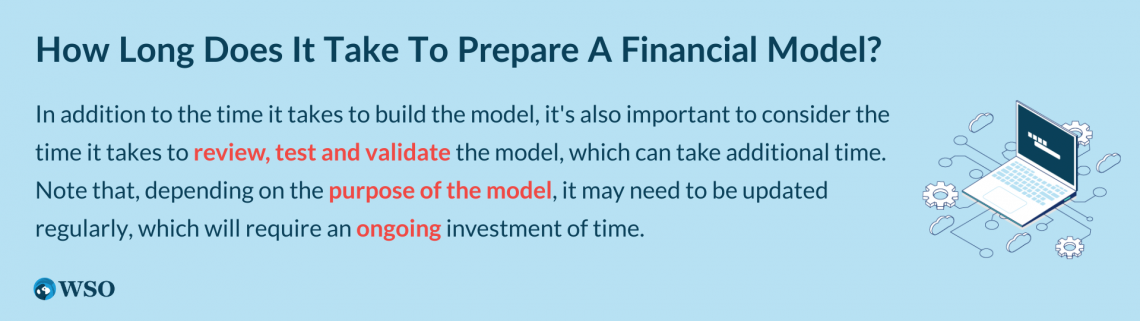
How long does it take to prepare a financial model?
Since financial models must be detailed and precise with the information presented, they can take a significant amount of time (usually more than three weeks) to build from start to finish. The range is vast, and it is hard to pinpoint a precise timeline to answer this question as it depends on the complexity and size of the organization, the industry being analyzed, the assumptions made while building the model, the availability of information, as well as the experience of the modeler. From this Reddit post, it can be observed that for some people it can take few hours to build a model, while for others, it can take months. With so many possibilities, we will look at two of the most common types of financial models and how long they take to prepare:
- High-level models: These provide a high-level view of the organization and are usually used in the introductory stages of investment analysis. It is possible to create one within a day or two using a limited number of assumptions that are estimated rather than well-researched from historical data. The calculations based on this information will not be very accurate, nor will they be validated by the investors.
- Detailed models: These models contain well-researched assumptions such as historical data for the past 3-5 years pulled from the SEC or a reputable source like Bloomberg. There would be a lot more error checking, sensitivity analysis, and stress testing with the results obtained from the it. Based on the level of detail required and the modeler’s experience, these models could take anywhere from a few weeks to a month or two.
Learning the shortcuts and best practices from our Excel Modeling Course will help you drastically improve your financial modeling speed. Here is a brief video from the course teaching you about conditional formatting:
What professions can you pursue after financial modeling?
This tool is used by many types of professionals within the finance industry. A few examples of such professions include the following:
- Accounting
- Buy / Sell-side research analysis
- Corporate development
- Credit analysis
- Equity research
- Financial planning & analysis (FP&A)
- Investment banking (IB)
- Management, business owners, and entrepreneurs
- Private equity (PE)
- Valuation and risk analysis
- Venture capital (VC)
Of course, financial modeling is just a skill and knowing the topic is not enough to instantly get you a job in the industries mentioned above, as experience is vital. If you have questions regarding a career that requires financial modeling, be sure to check out our forum, where you can find posts like careers with a lot of financial modeling besides i-banking and various other topics from people with jobs that heavily rely on this skill, such as those in the investment banking forum.
What skills and knowledge do you need for financial modeling?
There are many skills that would improve your ability to build financial models, along with the other tasks associated with it, such as gathering information before modeling, presenting your findings, and much more. Below are some of the skills that are helpful to financial modelers:
- Knowing corporate finance concepts and other theoretical aspects of the financial industry, such as accounting (the three financial statements and the relationship between them) and financial management principles.
- Knowing how to use spreadsheet software like Excel.
- Analytical and quantitative skills to analyze and draw conclusions from the results of the model. These skills also involve being able to focus both on the minor details and the big picture.
- Solid business understanding and ability to tackle complex business problems with strong problem-solving skills.
- Presentation and interpersonal skills are also critical as modelers are often required to present their findings to decision-makers and investors. A grasp of what good design and aesthetics are and being very attentive to details will improve the quality of presentations.
- For investment bankers, long working hours mean planning, organizational, and time management skills are paramount to their career and life in general.
Financial modeling courses
Here at Wall Street Oasis, we have multiple courses specializing in the various stages of financial modeling that have been mentioned in this article. For example, our Financial Statement Modeling Course focuses on analyzing each of the three financial statements and linking them together. At the same time, our Excel Modeling Course is full of tips and tricks to fast-track your progress when using the tool to perform analysis.
We also have modeling courses for other niche areas, such as PE firms, where it is crucial to know how to model for an LBO in the LBO Modeling Course. Below is a video from our LBO Modeling Course to give you an idea of what you can learn:


More about Financial Modeling
To continue learning and advancing your career, check out these additional helpful WSO resources:


or Want to Sign up with your social account?