Types of Financial Models
The 10 most common types of financial models.


Top 10 Types of Financial Models
Both investors and companies rely on financial models to make key business decisions about where to invest and how to allocate funds. Hence, understanding these models is of the utmost importance for a career in finance.
Many of these models are built to analyze financial ratios and the relationship between various financial metrics. In many cases, analyzing various companies will have industry-specific variables that are valuable for comparison.
As financial models primarily involve analyzing companies' historical financial statements, some knowledge of accounting can be extremely helpful in interpreting and creating these models.
In this article, we cover the top ten types of financial models used by finance professionals and two more used by specialists in certain niche financial roles.
Below is a list of the ten most common types of financial models (+ 2 bonus models):
Examples Of Financial Models
Financial models are speculative, and forecasts are not always accurate. It can be very hard to accurately predict the future values of securities, as many professionals develop different methods over time and use different ratios that they believe best reflect the market.
In some cases, models with few variables can be the most reliable because those with more variables are based on more assumptions about the future and may not be consistently reliable
Becoming proficient at creating and interpreting financial models takes time and practice. Below are some of the most commonly used financial models and when they may be used.
1. Three Statement Model
The three-statement model is a method of forecasting a company’s growth that relies on the three most important financial statements: The income statement, the cash flow statement, and the balance sheet.
These three statements are put into a spreadsheet such as Excel and linked together so that if any data in one statement is changed, the rest will change accordingly. An important part of this process is making sure that the financial statements are correctly linked together. A key part of building this model is researching the historical financial statements of the company.
Investors will perform horizontal and vertical analyses of these statements, focusing on the company's past growth trends, and overall performance.
Another key part of this model is examining important and relevant financial ratios. These ratios allow the company to make assumptions about its future growth and how the business model may change in the years to come.
Once the necessary assumptions are estimated, an investor can work on creating a forecasted income statement. After this statement is created, an investor can create a forecasted balance sheet, income statement, and cash flow statement.
This model is a good way to organize a business's forecasts, earnings, and expenses. It is generally used as a base for many other more complex financial models.


2. Discounted Cash Flow (DCF) Model
The discounted cash flow model is a method of analysis that predicts whether or not an investment will be profitable based on the cash flow it generates. The generated cash flow is discounted using the desired rate of return, which is called the discount rate, and takes into account the time value of money. This method generally uses the three-statement model as a starting point for its assumptions about growth if investing in a company.
Once an investor builds a three-statement model and calculates the forecasted growth and expected returns for each year of the investment, they can forecast the future cash flows, which are then discounted to reflect the net present value (NPV) of the returns. Usually, a company’s discount rate is calculated by finding its weighted average cost of capital (WACC). The equation to discount the net cash flow on investment looks like this:
Discounted cash flow = R / (1 + d)n
Where,
- R = Given years net cash flow,
- d = Discount rate, and
- n = Number of years since the initial investment.
This equation is used for each year of forecasted net cash flow and added together to arrive at the value of discounted cash flows. This sum is considered the net present value of the investment, and when greater than the cost, it means the investment surpassed the desired rate of return and may be a worthwhile investment.
As with any business valuation methodology, many adjustments can be made to improve its accuracy. One such adjustment is to add back taxes and inflation into the equation, both of which are not accounted for in traditional DCF models.
Below is a useful video about setting up a discounted cash flow model from our DCF Modeling Course.
3. Dividend Discount Model
The dividend discount model is a common method of valuing stocks. One weakness of this model is that the stock being analyzed must offer a dividend.
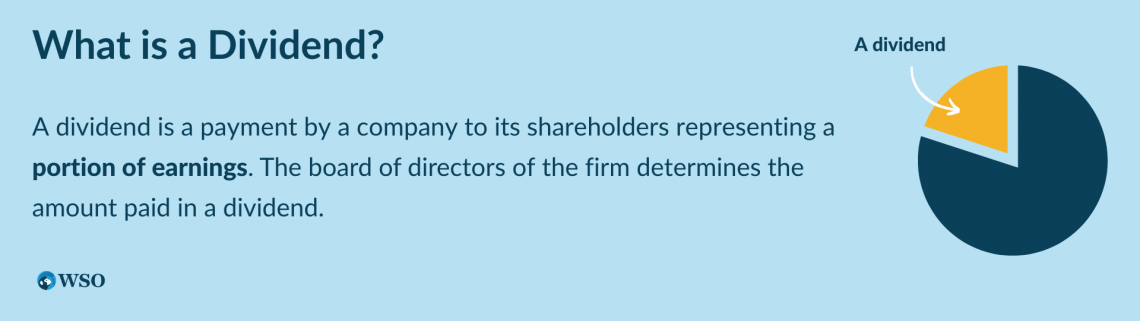
This method proposes that a company’s share price is equal to the sum of the present value of all of the company’s future dividends.
Because dividends are a part of a company’s earnings that are paid to stockholders, this model proposes that an increase in dividends is related to a company’s overall growth and revenue and that dividends can be used to estimate a company’s profit. The most common version of the dividend discount model is the Gordon growth model.
To use this method, an investor must forecast future dividend payments. Usually, investors look at past dividend payments to forecast future dividends. The Gordon growth model assumes a constant rate of growth for dividends, although not all methods of the dividend discount model do. The Gordon growth model equation is as follows:
Share price = D1 / (r - g)
Where,
- D1 = Forecasted dividend price for the next year,
- r = Company’s cost of equity, and
- g = Estimated constant growth rate.
The result of this equation is considered to be the intrinsic value of the company, and if it is greater than the company’s actual share price, it is considered undervalued and a good investment, and vice versa.
4. Comparable Company Analysis Model
The comparable company analysis model is a common way to value security and is often used in conjunction with other models to arrive at a value for a given stock. Rather than looking at a security’s intrinsic value, this method uses its extrinsic value based on comparisons to similar companies. It requires comparing relevant and important company metrics to industry averages and other companies of similar size within the same industry.
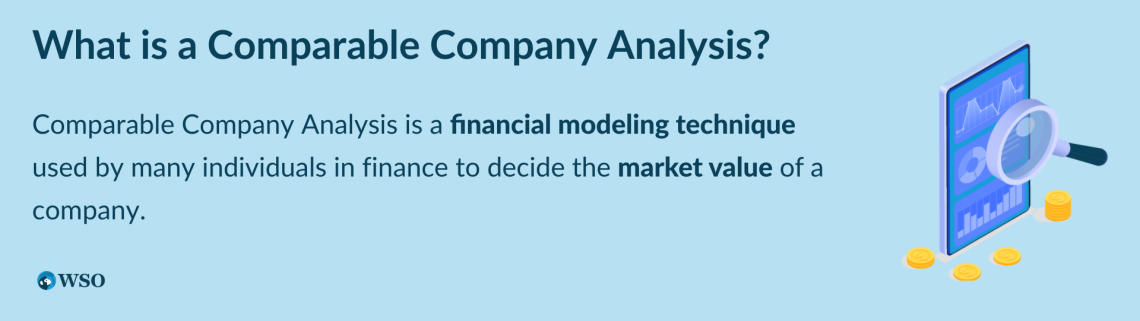
This method allows the investor to examine how similar companies are performing and base a company's value on industry performance. It is best done by creating a table of different industry-relevant metrics and including multiple businesses within each industry to compare and contrast them. Industry averages can also be included as a baseline to compare each company against another.
This method can be utilized very effectively when combined with a top-down approach. For example, if macro factors in the economy are forecasted to be favorable for a specific industry, it could be beneficial to compare the different companies before investing.

5. Merger Model (M&A)
The merger model is used to value a company’s tangible assets and the cash flows those assets generate. The merger model may be used if investors would like to forecast the result of a merger or acquisition or if a company is considering merging with another company.
This model is more complicated than other valuation models because it involves forecasting the effects of a transaction with many variables involved. This also involves building multiple types of financial models to build the merger model.
Usually, the process involves creating a three-statement model for both companies and using these models to forecast their growth. Finally, an investor will value both companies, usually using a discounted cash flow model and comparable company analysis.
Investors will combine the forecasted balance sheets of both companies to understand the merger's results. This involves making many changes in both companies’ (acquirer and acquiree) balance sheets based on assumptions about how they will change due to the merger.
One such variable may be the purchasing price of the company being bought. The process of generating extra value by the two companies due to the merger is called synergy. Some important synergies to consider might be a reduction of costs and how each company’s segments may be able to merge to improve overall efficiency.
Usually, companies merge because they believe that the value of the businesses together is greater than their separate values and that their business models complement each other. In many cases, a company will acquire its supplier in a vertical merger, which can reduce input costs for the company.
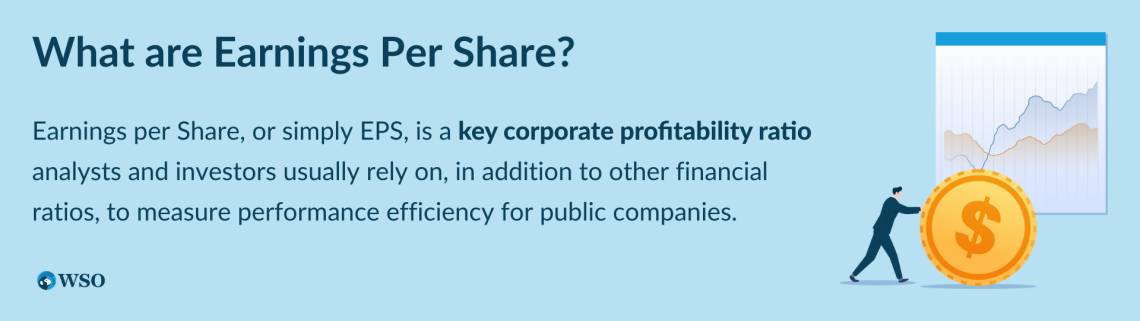
Synergy is often one of the reasons companies merge and should be considered when finding the company’s new value. Once the companies’ balance sheets are merged, an accretion/dilution analysis is initiated. This process estimates whether the company’s earnings per share (EPS) will rise or fall due to the merger, accretion being an increase in EPS, and dilution being a fall in EPS.
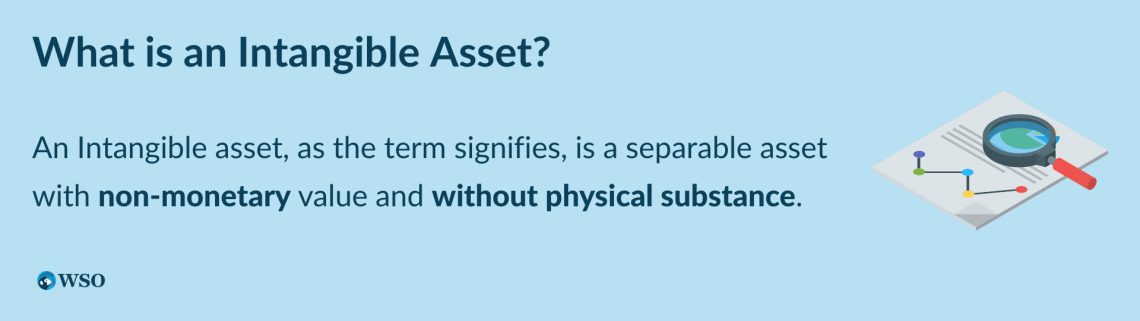
The Merger process is divided into three steps: discover, analyze, and negotiate. In discovery, the target company identifies potential targets for acquisition or merger. The target’s financial records are then analyzed using financial models that derive an appropriate value for the target company by considering all of its tangible and intangible assets.
Once this value is calculated, it can be compared with the acquirer’s stock valuation to determine whether the proposed deal makes economic sense. Finally, negotiations start once both parties are willing to go through with a deal. Generally, the acquirer will already have a price range that it is willing to purchase the company for that would be profitable for the acquiring company before starting negotiations.
Learn more about M&A models in the video below.
6. Initial Public Offering (IPO) Model
The initial public offering (IPO) model is a stock distribution strategy that involves the first sale of stock of a new or existing company to the public. The earliest IPO on record was by a Dutch merchant in 1602. In 1927, the US Securities and Exchange Commission (SEC) established a definition for an IPO that would become standard practice around the world: “the offer and sale of securities by a company in exchange for capital raised from investors through a prospectus or private placement memorandum.”

The initial public offering model is used to value a company and find a price at which it should initially offer its stock. This model can be complicated because it rests on many variables used to predict demand for company shares and its future growth.
Companies typically look at their financial statements and create a three-statement model to understand their historical better and predicted financial performance. They also tend to use comparable company analysis to contrast themselves with other companies and present how their stocks are expected to perform relatively.
While a company’s intrinsic value is extremely important and certainly affects investor outlook, the most important part of an IPO model is gauging demand for the company’s stocks. In particular, companies include an IPO discount to ensure demand for their stock and good stock performance. This means that they sell the stock at a slightly lower price than what is believed to be its true value, so demand is higher.
7. Leveraged Buyout (LBO) Model
A leveraged buyout (LBO) is a form of corporate finance maneuver. As part of it, a company finances its purchase of another company by borrowing money from investors, who typically receive an ownership stake in the acquired company.
This type of acquisition involves two or more companies entering into a transaction in which the acquirer borrows money to acquire the target company. The acquisition generally results in the acquirer taking over management control while the target company retains its organizational structure and brand name.
In an LBO transaction, and by extension, LBO models, debt-to-equity ratios range from 2:1 to 50:1, with the possibility of even higher ratios as well.
An acquiring firm will take on many different types of debt to buy another company as part of an LBO. First, it must ensure that this transaction is profitable after paying interest and debt. The debt is usually paid off from cash flows from the newly acquired business or a business resale later on.
Firms usually look for a minimum internal rate of return (IRR) of 20 - 30% for these types of transactions to ensure that they can cover their debt and still make a sizable profit. This model consists of a firm’s valuation of the company, expected future profit, and debt schedules for debt they are expected to take on.
A company may perform a valuation using a three-statement model and discounted cash flow analysis. This model may look similar to a merger model but is slightly more complicated because the company must consider a very large and complex debt schedule.
An LBO can increase value for all shareholders involved by increasing operating efficiency and boosting cash flow. It also enables the acquiring entity to have greater access to capital markets than going public or seeking outside financing.
8. Sum Of The Parts Model
The sum of the parts model, also called breakup value analysis, analyzes the different parts of a company individually and then values the company as a sum of its parts. This method is usually useful for fairly large companies with many different operating segments in different industries. However, in some cases, this method could add up different projects within a company to find its value, even if they are not different segments or industries.
Analysts using this model look at each business line separately and value each segment as though it were its own business. This may involve using multiple other models, such as the three-statement model, discounted cash flow model, and comparable company analysis, to evaluate each separate wing of the business.
Then, as the name suggests, the analyst will add each of these segment valuations together to arrive at the total enterprise value, meaning the entire company’s value. An equation to find the total sum value of a company from its parts follows:
Total Value = V1 + V2 + V3 … + Vn - D + A
Where,
- V = Value of each segment up to n segments,
- D = Net debt,
- A = non-operating assets and liabilities.
As this kind of analysis gives a higher relative valuation compared to other methods, it is generally used to defend a company’s value in the case of a hostile takeover. If it can prove that it is worth more than it is being bought for, it just might be able to fend off a hostile takeover. This type of analysis may also be used to calculate a company’s value post-restructuring.
9. Budget Model
A budget is a plan for allocating money to achieve a goal. Budgeting is an activity that is usually performed by governments, businesses, individuals, and families.
The budget model is the most common type of financial model because it’s the standard approach used by many government entities and corporate businesses. Three common variables to consider in the creation of a budget model are revenue, cost of goods sold (COGS), and administrative expenses.
Revenue is the amount of income generated by the company or entity that can be tracked over time, while costs of goods sold vary with changes in volume or units produced. Administrative expenses are salaries and wages paid to employees who produce goods or services for the organization and tend to be stable despite varying production levels.
All three of these variables may be hard to predict. Further, there are many different ways to allocate money across an organization which only increases the complexity of budgeting. Below is a breakdown of the most common methods of budget creation.
Static Budget
It is one of the most straightforward types of budgeting. This type of budgeting involves making fixed forecasts for the year about how much the organization is likely to spend in different endeavors and allocates its funds accordingly.
It is important to keep reasonable expectations in mind when creating this budget because expectations rarely translate into reality. Unfortunately, this model also has the negative consequence of having very little flexibility if it is wrong in its forecasting.
Flexible Budget
A flexible budget is a good way of accounting for variables in an organization. This method creates multiple budgets designed to account for changes an organization may see throughout the period for which the budget is created. In many cases, companies will make flexible budgets to compensate for fluctuations in sales.
For example, imagine a company with a static budget going over budget. This looks negative, but the company may have gone over budget because it sold more products than expected and had to pay for more input costs, which is very good. The flexible budget avoids this by presenting multiple scenarios such as when the company sells the expected amount of goods or sells more or less than expected.
Other Types of Budgets
A zero budget is when a company starts a budget from scratch for each period. This gives management flexibility to choose what goals the organization should set for that period and allocate funds based on what they would like to do. This budget is good for choosing which projects to prioritize and giving them the funding they need.
A rolling budget is when a company budgets for a certain horizon and reassesses to budget a specific amount of time out constantly. For example, if an organization budgets a year out, at the end of one month, it would drop the past month and budget for the month a year out, and continue to do this, hence the name.
The performance budget model allocates money based on the performance of different segments. For example, this model may consider the return on total assets and asset turnover of different segments to see which one is creating the most revenue and using money efficiently.
Check out this page for a Budget Analysis Spreadsheet Template.
10. Forecasting Model
A forecasting model is a financial model that generates estimates of expected cash flows and future values. It is generally used to estimate a firm’s value on a given date. It is used in the derivation of many other models, such as the discounted cash flow model.
The key inputs for a forecasting model are expected cash flows, discount rates, and terminal values (TV).
Below are examples of forecasting models that are commonly used:
Causal Models and the Econometric Model
Causal models such as the econometric model determine relationships between variables to establish a reliable forecast. For example, the econometric model may consider current events and how they interact with supply and demand to forecast the future value of a company or project.
Qualitative Models and the Delphi Model
Qualitative models such as the Delphi model utilize expert opinion to reach a reasonable conclusion. The Delphi model, named after the Oracle of Delphi, assumes that a group of experts is better at forecasting than any single person and usually has multiple rounds of forecasts, during which experts revise their forecasts based on the forecasts of others.
The time series model uses historical data to predict future company growth patterns. This model works best with large companies and has had reliable growth for multiple years.
In many cases, investors will take a mixed approach to forecasting, considering many different factors when valuing a company or proposition.
11. Option Pricing Model
An option is a contract that gives the buyer the right to purchase a security at a given price in the future. Usually, the size of the contract is 100 units. Options are sold at a premium, and the agreed-upon price of the security is called the strike price (the price from which this option contract becomes profitable to exercise). In many cases, options will expire worthless because the security does not reach its strike price.
The value of an option contract is determined by its underlying asset price and time to expiration. For example, for a call option, this means that if the price of a stock is expected to increase, then the value for that option on it will increase as well. Conversely, if it assumes a price decrease, the value would drop.
This type of financial model often has several assumptions: volatility and interest rates are two key factors in determining values. Some of the most common option pricing models are described below
Black-Scholes Model
This model was created based on European options, which operate slightly differently than American options in that you cannot exercise them before the expiry date. The Black-Scholes model requires the following inputs:
- Volatility
- Strike price
- The risk-free interest rate
- Time until expiration
- The price of the underlying asset.
This equation assumes that the security will move according to the geometric Brownian motion. This model is considered one of the best option pricing models and is hence widely used.
Binomial Model
This model calculates multiple iterations of movement in the stock price and creates two potential paths from each iteration. It contains a binomial tree meaning that each potential price then branches off into potential price movements, either up or down. Investors calculate the probability of these movements and the option’s value at each node and work back to find the option’s current value based on potential future values and the probability of where the price moves.
Trinomial Model
This model is more advanced than the binomial model because it takes into account three possibilities rather than only two. This is known as a trinomial tree because it includes three trajectories for the security: going up, going down, or staying at the same price, and estimates multiple iterations of this movement. This model then aims to calculate the probability of each of these scenarios and the options prices at each node and work backward to find the option’s current value.
12. Pricing Models
Pricing models determine how much a company should charge for a particular product or service. This can be determined in several ways. Most importantly, a company needs to consider forecasted demand for its product or service and the costs that it incurs to deliver it, which vary based on the number of units sold.
One way to determine the price of a product is called cost-based pricing, which takes the costs of creating the product and multiplies that figure by a profit percentage to derive a desired rate of return. Sometimes a fixed amount is added to achieve a desired absolute profit per unit.
Another way to choose a product’s price is by using value-based pricing, which considers the demand from customers rather than the cost of production.
This pricing model can be much more difficult because it considers a much more variable set of data: customer demand. It is very difficult to estimate what the product will be worth to customers, especially considering that different customers will value it differently. This method usually relies on customer feedback or the history of related products.
Competition-based pricing involves examining the prices of competing products that could substitute for the product and basing the price on similar market prices. In competitive markets, sellers are known to be “price takers,” meaning that they must sell their products at the market price or else customers will buy substitute products from competitors. This type of pricing strategy follows that notion.


More about Financial Modeling
To continue learning and advancing your career, check out these additional helpful WSO resources:


or Want to Sign up with your social account?