Cash Flow
It is a summary of the sources and applications of cash for a time-period


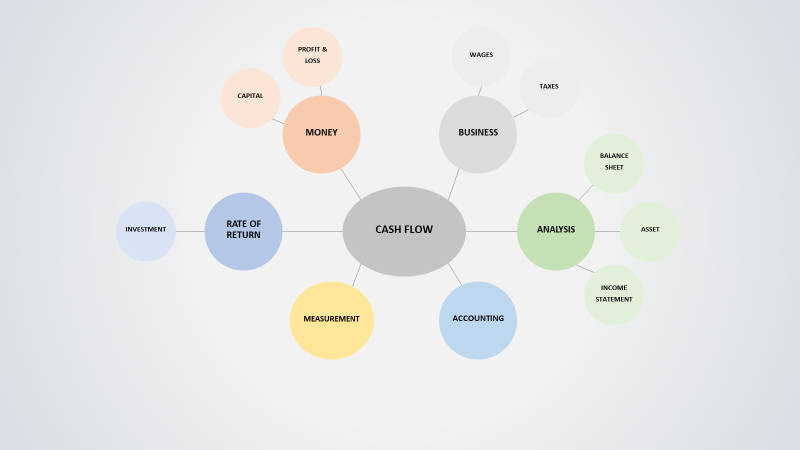
What Is Cash Flow?
A cash flow (CF) shows inflows (receipts) and outflows (payments) of cash during a particular period. In other words, it summarizes the sources and applications of cash during a particular period. In addition, it analyzes the reasons for changes in the balance of cash between the two balance sheet dates.
The term "cash" here stands for cash and cash equivalents. It includes only those items that affect cash. It can be for the past or be projected for a future period.
In the form of notes and coins, cash is legal tender in hand or bank. Cash includes negotiable instruments, prize bonds, bank pay orders, undeposited checks, postal orders, and bank draughts.
Cash equivalents are short-term, highly liquid, and risk-free assets that can be converted into cash in three months and used to pay debts.
Maintaining a healthy business requires consistent CF. Managers must be aware of its significance and adept at analyzing it for both short-term and long-term gains.
The essential part of the analysis is related to financing, operations, investments, and profits. This is useful during critical periods because it allows them to be prepared when investing, taking loans, repaying debts, and even reducing the workforce if it affects the business.
Profits keep improving our ability to pay bills, suppliers, and employees since they are useless if we have no cash on hand.
Similarly, being required to invest profits in other departments should not be considered a loss. Profits can be increased through wise investments, but even a profitable business can fail without cash.
In its most basic form, a payment (in a currency) is typically made from one central bank account to another.
The term is most commonly used to describe payments that are expected to take place in the future, are thus uncertain, and must now be forecasted using it.
A key takeaway for the following people and organizations:
- The accounting staff needs to know if the company will be able to fund payroll and other pressing costs.
- Those looking for a clear picture of a company's ability to repay, such as potential lenders or creditors.
- Interested investors that want to see if the company is financially stable.
- The company's stockholders.
- Company administrators are in charge of the company's governance and are accountable for ensuring it does not trade while bankrupt.
- Interested employees or contractors want to know if the company will be able to pay them.
Objectives of Cash Flow
CF must provide critical information on an organization's assessing solvency and liquidity position when predicting the future.
- It must eliminate all effects of different accounting methods and improve the comparability of different firms operating performances.
- It must provide data to assess equity, liabilities, and asset changes.
- It should lead to the probability assumption, timing, and amount of future cash flow.
- It should aid in the planning of financial activities in the short term.
- It should make efficient cash management possible.
- It must aid in the development of cash budgets and sound business policies.
Purpose of Cash Flow
This aids in determining the sources of cash inflow and whether or not it is utilized within a specific time frame.
It is essential for proper cash planning and management and maintaining a balance between cash inflow and outflow.
Investors can easily detect the efficiency, or lack thereof, with which a company generates CF.
Capital investment programs are appraised using a CF, determining their viability and profitability.
It allows for the evaluation of net assets and other financial reports.
A company's CF must be stable and optimized.
It assesses a company's overall health and enables investors, creditors, and shareholders to assess its financial viability and ability to pay for operational expenses.
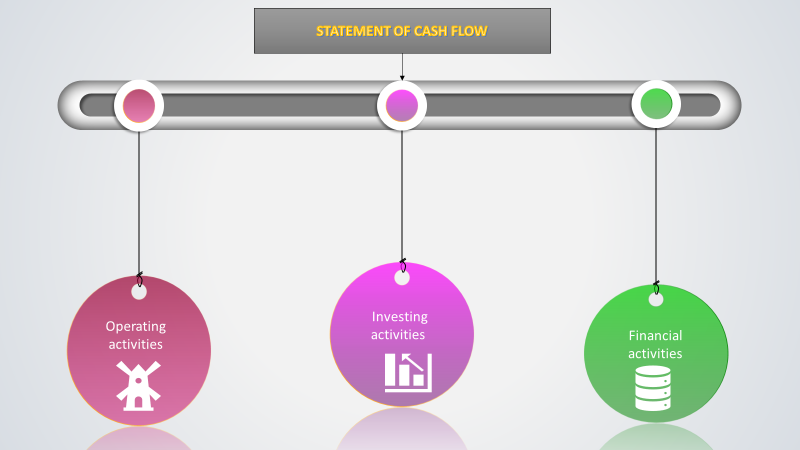
Preparing a statement of cash flows
Orders of presentation:
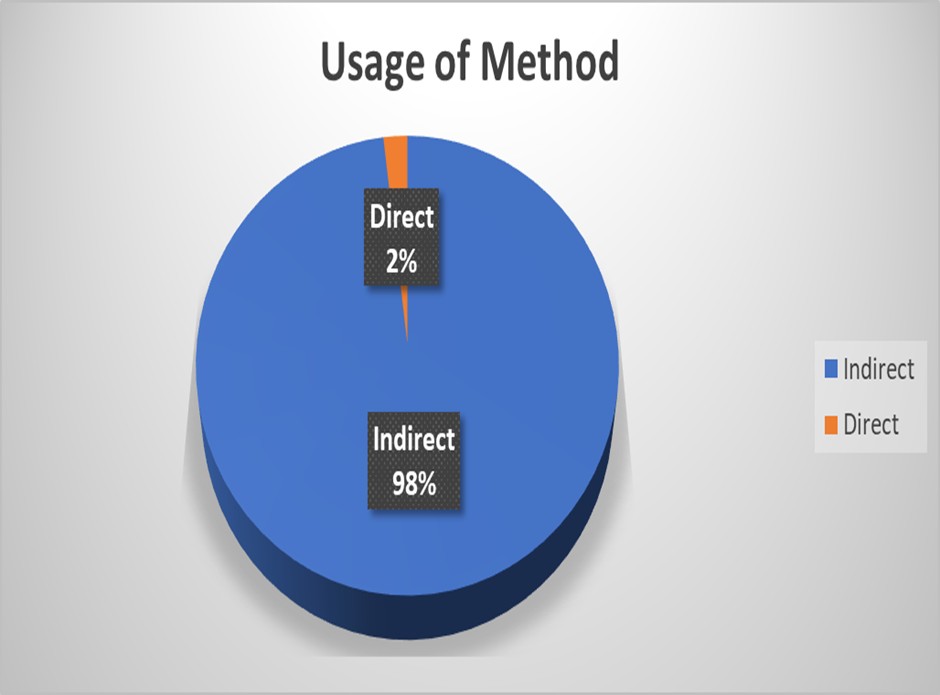
- Operating activities (Direct Method or Indirect Method)
- Investing activities
- Financing activities
Three sources of information
- Comparative balance sheets
- Current income statement
- Additional Information
Companies favor the indirect method because it mainly focuses on the differences between net income and net cash flow from operating activities and is easier and less costly to prepare.
Different Types of Cash Flow
Different types of CFs are discussed
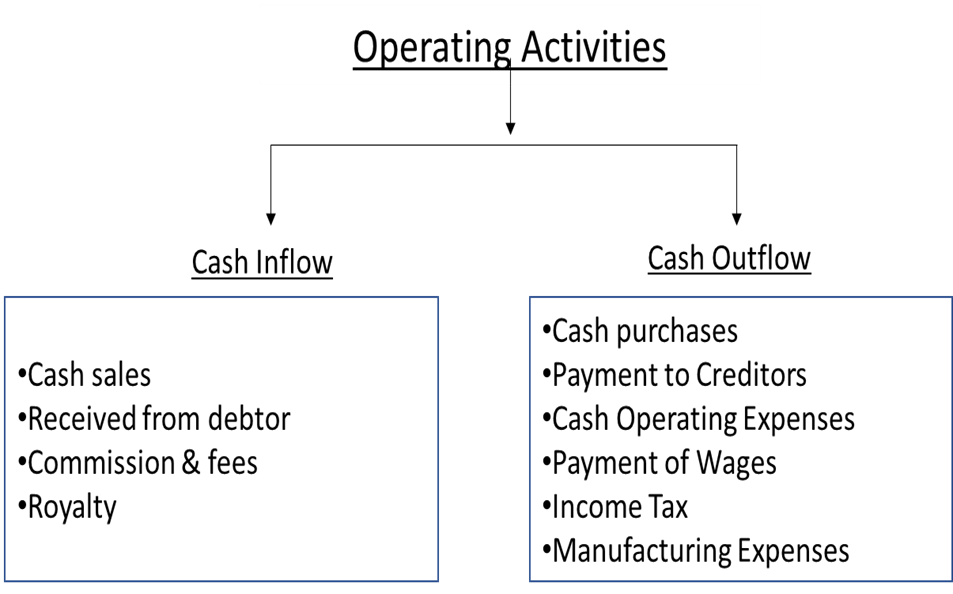
Cash Flows From Operating Activities
Operating activities are the main revenue-generating activities of an enterprise. As such, they include those transactions and events which enter into the ascertainment of the net profit or loss of the enterprise.
The first part covers operational business activity transactions and is used to determine whether or not a company is financially viable in the long run.
It takes into account the money spent on the manufacture and selling of items. It analyzes incoming finances to determine whether or not an organization can cover operating expenses.
It tracks cash inflows and outflows directly related to a company's main business operations. Inventory and supply transactions, as well as employee salaries and bills, are examples of these activities.
To calculate the positive or negative flow, these operational costs are deducted from the organization's net income, hence why it's referred to as a company's net income in cash.
When calculating it from operations, accounts payable, amortization, and depreciation are all considered.
Cash affects the transaction on net income.
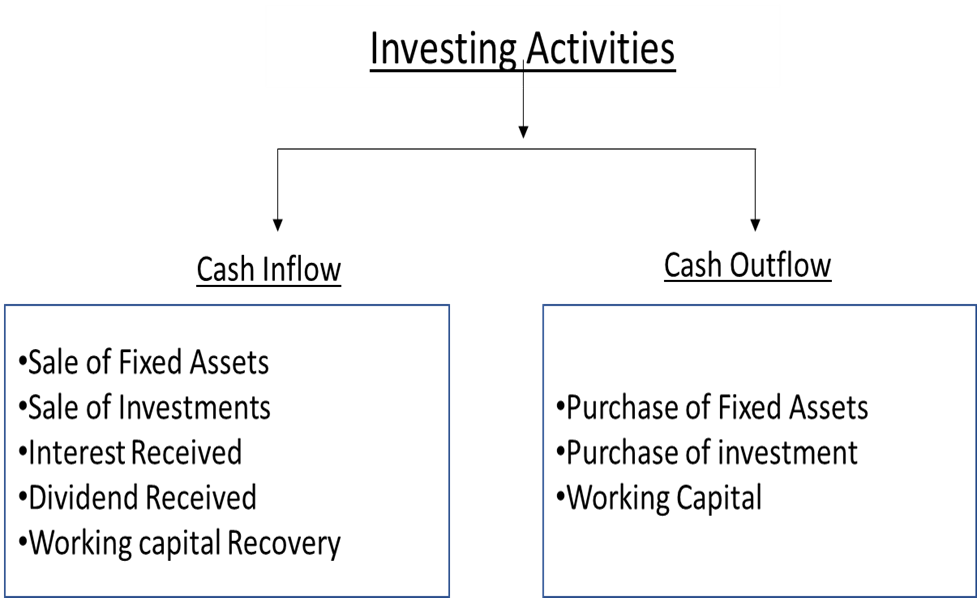
Cash Flows From Investing Activities
Investing activities include purchasing and selling long-term assets such as land, buildings, plants, machinery, etc., not held for resale.
These activities also include purchasing and selling such investments, which are not included in cash equivalents. Investing activities disclose the expenditure incurred for resources intended to generate future income and cash flows.
The cash that goes toward a company's long-term health is recorded. This section includes cash spent on R&D, plant, property, and equipment as analysts look for changes in capital expenditure.
Increasing capital expenditure implies a reduction, which may or may not be bad. However, negatives also can indicate that a company is making strategic investments for future operations.
Growing businesses typically spend more on capital. Although positive flow from investing activities may appear to be good, investors typically prefer organizations that invest in improvement and innovation while aiming to generate cash from operations.
Investing is fundamental, even if it's negative and a result of gains and losses from investment.
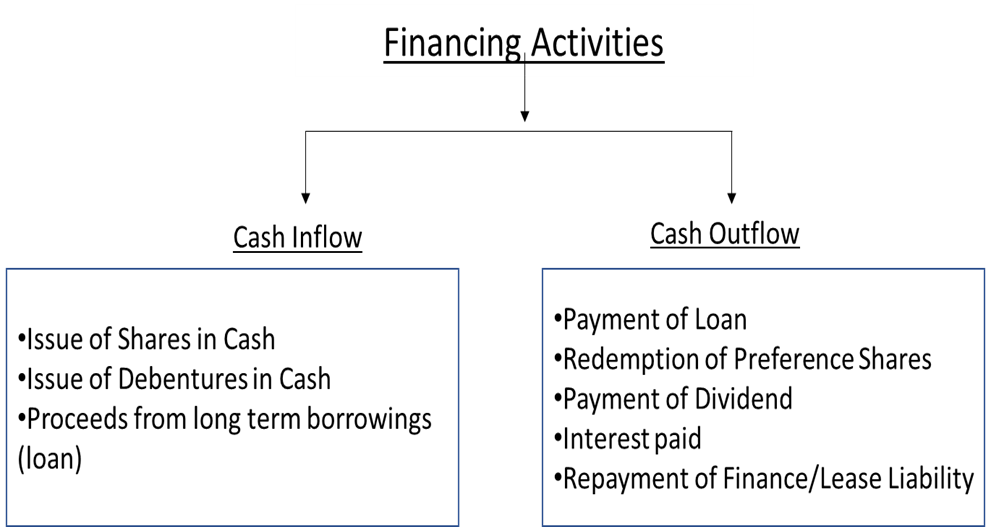
Cash Flows From Financing Activities
Financial activities are transactions or business transactions or business events that affect long-term liabilities and equity. In other words, financial activities are transactions with creditors or investors used to fund either company operations or expansions. These transactions are the third set of cash activities displayed on the statement of cash flows.
Financing denotes an organization's financial strength and reveals how well its capital structure is accomplished. In addition, it provides an overview of the cash associated with business financing, which is reported to shareholders annually.
It depicts how cash is used to fund debts, equity, and dividends flow between owners, investors, and creditors.
By analyzing this section, we can determine what an organization has paid in share buybacks and dividends. It is also useful in determining how an organization will fund its operational expansion.
This section lists the cash from capital fundraising and the loans given back. A positive flow in financing indicates that an organization's money is coming in faster than it is. Conversely, negative figures are typically associated with debt payments, dividend payments, or stock buybacks.
Shareholders and investors in a company will want to get the most profit out of their investments. As a result, information about an organization's payables and receivables is critical. Moreover, it is an efficient way of gathering critical information about money flows into and out of business.
Although it can be done once a year, companies should evaluate their CF more frequently to show investors how healthy their businesses are and to have a clear financial picture for strategic planning.
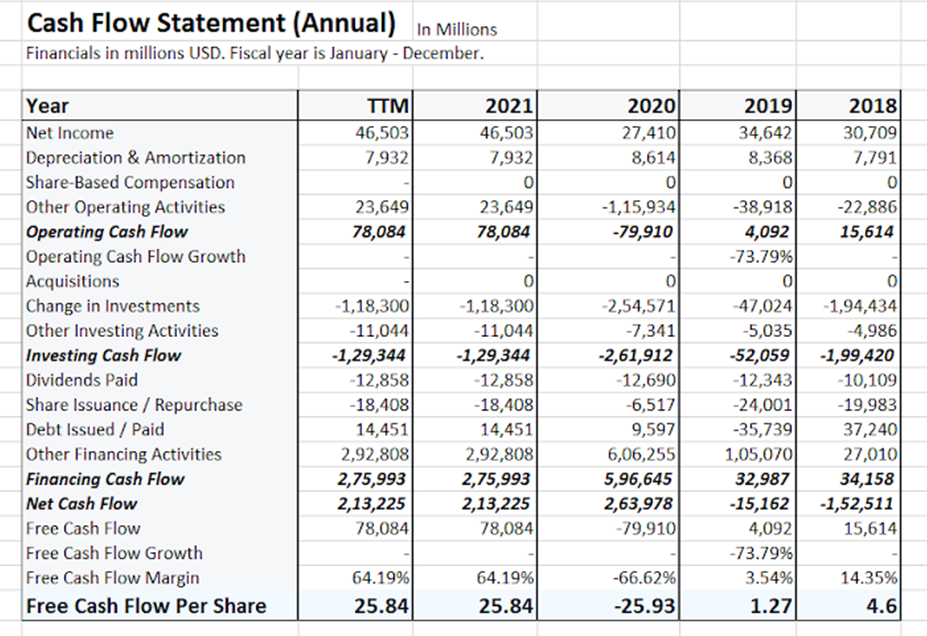
Example of Cash flow
JPMorgan Chase & Co. annual or quarterly free cash flow history and growth rate from 2018 to 2021
In 2021, JPMC's yearly FCF was $78,08 million, down 197.71 percent from 2020.
In 2020, JPMC's yearly FCF was $-79,91 million, down 2052.83 percent from 2019.
JPMC's yearly FCF was $4,092 million in 2019, down 73.79 percent from 2018.
Income Statement
JPMC generated revenue of $121,65 million and earnings of $4,650 million in the previous year. The profit per share was $15.36.
Free CF is a financial performance indicator computed as operating -capital expenditure.
| Particulars | Amount |
|---|---|
| Revenue | 12165M |
| Gross Profit | 12165M |
| Operating Income | 5031M |
| Pretax Income | 5773M |
| Net Income | 4650M |
| EBITDA | 6566M |
| EBIT | 5773M |
| Earnings Per Share (EPS) | $1536M |
Balance Sheet
The company has $740.83 billion in cash and $548.94 billion in debt, giving a net cash position of $191.90 billion or $65.33 per share.
| Particulars | Amount |
|---|---|
| Cash & Cash Equivalents | 74083M |
| Total Debt | 54894M |
| Net Cash | 19190M |
| Net Cash Per Share | $6533M |
| Book Value | 29413 |
| Book Value Per Share | 10014M |
| Working Capital | n/a |
The formula involved for the calculation terms are:
Liquid Assets (Acid Test) = [Current Assets – Stock – Prepaid Expenses]
Current Assets = Cash in Hand + Cash at Bank + Bills Receivable + Short Term Investment + Debtors + Prepaid Expense + Stock (Stock of Finished Goods + Stock of Raw Material + Work in Progress)
The Liquidity ratio of the company has been consistent over the years.
Net Profit Ratio: The relationship between the net profit that a Company earns and the sales of that company is mathematically given by the Net Profit Ratio.
The calculation of the term is:
Operating Net Profit = Operating Net Profit / Net Sales *100
The net profit margin of the company has been on an increasing trend over the years
meaning that the net profit has increased with sales.
Return On Assets
JPMC's historical return on assets (ROA) figures for the last five years.
Return on assets (ROA) is a measure of a company's profitability concerning its total assets. Divide a company's operational earnings by its total assets to arrive at this figure.
| Date | Net income | Total Assets | Return on Assets |
|---|---|---|---|
| March 31, 2022, < | $40,500M | $3,954,690M | 1.07% |
| March 31, 2021 | $38,830M | $3,689,340M | 1.15% |
| March 31, 2020 | $28,320M | $3,139,430M | 1.00% |
| March 31, 2019 | $31,220M | $2,737,190M | 1.18% |
| March 31, 2018 | $24,830M | $2,609,790M | 0.97% |
Return On Equity
JPMC's current and historical return on equity (ROE) values over the last five years.
The amount of net income returned as a percentage of shareholders' equity is known as the return on equity. Return on equity is a metric for determining a company's profitability by disclosing how much profit it earns with the money invested by shareholders.
| Date | Net income | Total Assets | Return on Assets |
|---|---|---|---|
| March 31, 2022 | $40,500M | $285,900M | 14.01% |
| March 31, 2021 | $38,830M | $280,710M | 14.18% |
| March 31, 2020 | $28,320M | $261,260M | 10.79% |
| March 31, 2019 | $31,220M | $259,840M | 12.09% |
| March 31, 2018 | $24,830M | $256,200M | 9.65% |
Conclusion
A cash flow can reveal a company's strength, profitability, and long-term future prospects. A company can help determine whether it has enough liquidity or cash to pay its obligations. It can also help a company budget by forecasting future cash flow.
For investors, it is a barometer of a company's financial health, as the more cash available for business operations, the better. However, this is not a firm rule. For example, extending a company's activities might occasionally result in negative flow.
An investor can understand how much cash a company earns and thoroughly understand its financial well-being by studying its cash flow.


Researched and authored by Akhilesh Jagtap | LinkedIn
Free Resources
To continue learning and advancing your career, check out these additional helpful WSO resources:


or Want to Sign up with your social account?