Excel for Finance
It is a streamlined and powerful tool that can help you efficiently create top-notch models


Guide to Excel for Finance
Excel for Finance is an essential tool for anyone pursuing a career in finance. Excel is a streamlined and powerful tool that can help you efficiently create top-notch models. Here, we'll explore some important Excel functions that are particularly useful in the world of finance.
In the realm of financial services, Excel is a priceless asset. Any data can be visualized, categorized, and manipulated as long as it is quantifiable.
It's important to note that Excel has a vast number of functions, and it's unlikely that anyone can master them all. However, for those entering finance as analysts, it's crucial to focus on the functions that are most relevant to your specific role.
A smart approach when using Excel is to follow the 80-20 rule. This rule suggests that around 80% of the tasks you'll encounter in your job can be accomplished using just 20% of Excel's functions. So, by concentrating on mastering the most important 20%, you can significantly enhance your effectiveness in a finance role.
- Excel is vital for finance, offering data manipulation and visualization for analysis and modeling.
- Focus on 20% of functions for 80% of tasks, honing key skills for finance roles.
- Excel aids investors, planners, and accountants in analysis, performance, and cost accounting.
- Functions like FV, PV, PMT, RATE, and NPER are crucial for investment, loan, and valuation decisions.
- NPV, IRR, and MIRR assist in evaluating cash flows and project viability in finance.
Excel for Investing, FP&A, and Accounting
Investors typically use Excel to focus on information from a firm’s financial statements to see how they operate. By analyzing financial statements, investors can see how efficiently a company uses its cash and where it may need to cut back.
Financial statements can also give investors insights into what a company plans to do in the future. For example, if a manufacturing company’s balance sheet shows increasing PP&E purchases, the firm may be preparing to open another plant.
Financial statements are crucial for business valuation. Ratios used in comps analysis are all calculated using company financials. Financial statements also provide the basis for projecting future cash flows, which bankers often do by creating DCF models, a key tool in valuation.
FP&A, which stands for financial planning and analysis, also uses Excel to create models and forecasts. However, whereas investors are more focused on modeling the performance of investment prospects, FP&A analysts are more focused on their firm’s performance.
By examining their company’s financials, FP&A professionals focus on operational efficiency, budgeting, and how the next dollar will be spent. FP&A analysis helps businesses make important financial decisions and understand the firm’s overall financial health.
Accountants use Excel for two purposes. The first is in financial accounting, whereby accountants prepare financial statements designed for external use by investors. But financial accounting rules are rigid and uniform, so many use different software.
Excel is much more suited to cost accounting. Because cost accounting reports are designed for internal use, accountants can create reports according to specific firm needs. As such, the program’s flexibility is attractive for cost accountants.

Time Value of Money Functions
The time value of money is essential to all things in finance. Therefore, regardless of role, financial services professionals will surely, make use of the following functions regularly.
1. Future Value (=FV)
Finding the future value of an investment is key to making good financial decisions. As the name would suggest, the =FV function does just that.
To calculate the future value, you must have a constant, compounding interest rate; the number of regular periods over which the starting balance is compounded; the payment amount per period; and the present value of the investment.
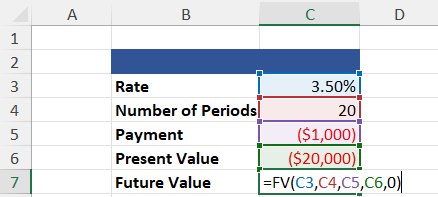
=FV(Rate, Number of Periods, Payment, [Present Value], [Type])
=$68,075.46
A few notes about the =FV function;
First, the “0” included in the calculation satisfies the [Type] category, which states whether payments are made at the beginning or end of the period. If no information is given, assume payments are made at the end.
Second, you’ll notice that the present value and payment are negative. This is because the =FV function calculates the future value of a cash outlay, and we treat the starting balance of the investment and the payments as such.
2. Present Value (=PV)
The =PV function is used to find the present value of an investment. In other words, this function returns how much cash needs to be invested to achieve a desired future value.
To perform this calculation, you need a compounding interest rate, the number of regular periods over which the starting balance is compounded, and the payment amount per period. The desired future value of the investment is optional.
The example below shows the present value calculation of an investment with no intermediate payments.
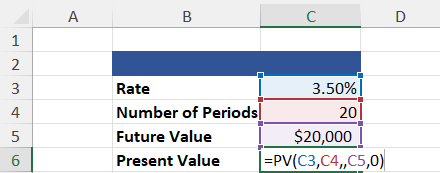
=PV(Rate, Number of Periods, Payment, [Future Value, [Type])
=($10,051.32)
You will notice that =PV has returned a negative value. Once again, this is because the present value is treated as a cash outlay. I.e., The return value must be invested to achieve the desired future value given the criteria.
You will also notice a double comma between the number of periods and the future value. This is the space where a payment argument would go. Since this example does not require intermediate payments, it is assumed to be 0.
3. Payment (=PMT)
The =PMT function can calculate the payment required for a loan or an investment. In either case, you need a compounding interest rate, the number of regular periods over which the starting balance is compounded, and the present value.
The desired future value is included when dealing with investments, and the function will return the payment required to reach that goal based on the criteria.
When dealing with a loan, however, the function returns the payment amount required to pay it off, so the future value is technically 0. Therefore, the future value need not need to be included.
The example below reflects the =PMT function used in a payment calculation on a $20,000 loan that will be paid off over two years.
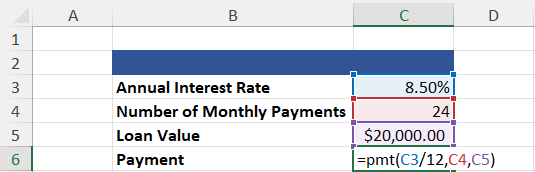
=PMT(Rate, Number of Periods, Present Value, [Future Value], [Type])
=($909.11)
Several aspects of this calculation are inconsistent with the previous example. First, why do we divide the interest rate by 12?
We do this because the criteria specify that payments will be made monthly. And because we are given the annual interest rate, we must divide the rate by 12 to get the monthly interest rate.
Second, why is the Loan Value–our present value in this example–positive instead of negative when present values are supposed to be treated as cash outlays?
If we performed this calculation on an investment, the present value would be negative because we are spending our money. However, in the case of a loan, the $20,000 does not come out of our pocket. Therefore, it is not a cash outlay.
4. Rate (=RATE)
The =RATE function is incredibly useful when dealing with loans and investments. If used in a loan calculation, the future value is optional and will be treated as 0 (unless otherwise specified).
In the example below, we will use the =RATE function to calculate the Yield to Maturity for a security given the number of payment periods, a coupon rate, the price of the bond, and the bond’s par value.
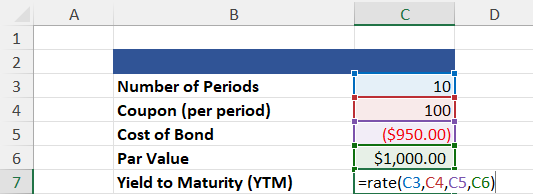
=RATE(Number of Periods, Payment, Present Value, [Future Value], [Type], [Guess])
=10.84%
In addition to [Future Value] and [Type], the =RATE function includes another optional argument: [Guess]. This argument is a guess of what you believe the interest rate is likely. Unless specified, the rate is assumed to be 10%.
You will notice that our coupon rate, which acts as our payment argument, is positive. This is the case because, in this example, coupon payments are cash inflows.
5. Number of Periods (=NPER)
The =NPER function returns the number of periods required to pay off a loan or reach a desired future value. It is calculated given a compounding interest rate, the payment amount, and the present value. A desired future value is optional, depending on the calculation used.
The following example will calculate the number of periods required to achieve a desired future value.
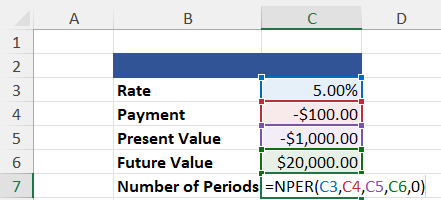
=NPER(Rate, Payment, Present Value, [Future Value], [Type])
=40.84
Capital Budgeting Functions
Like the previous five functions, the net present value and internal rate of return also have to do with the time value of money. These functions are most commonly used for capital budgeting.
1. Net Present Value (=NPV & =XNPV)
The =NPV function discounts a series of cash flows based on a specified discount rate to find the net present value of an investment. This is a crucial function for all financial professionals, as determining how much future cash flows are worth now is a key aspect of valuation.
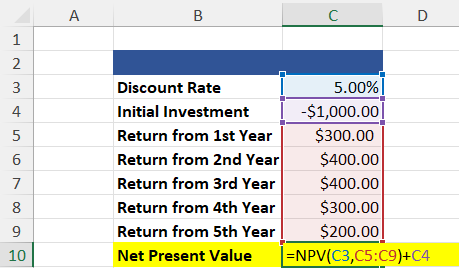
=NPV(Rate, Values) + Initial Investment
=$397.58
The example above uses the =NPV function, which calculates the net present value of a regular, periodic cash flow series. In most cases, however, the cash flows will be irregular.
To calculate the net present value of a series of irregular cash flows, we use the =XNPV function. This net present value of the function considers the dates on which cash flows were received.
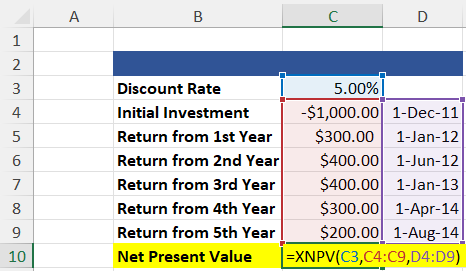
=XNPV(Rate, Values, Dates)
=$451.11
Both examples yield positive results. Anytime the net present value of an investment is positive (NPV > 0), the investment is considered “good” because it will make money. Conversely, when the investment’s net present value is negative (NPV < 0), it will lose money.
The =NPV function assumes that cash flows are received once annually. In reality, however, all cash flows are received within three years. Moreover, because the =XNPV function considers dates, it recognizes that the cash flows are much closer.
Based on the time value of money, we know that money now is worth more than money later. So, the =XNPV function yields a higher result. For this reason, =XNPV is preferred over =NPV.
2. Internal Rate of Return (=XIRR)
The internal rate of return on investment is closely related to the investment’s net present value. Ultimately, the IRR is the discount rate at which the NPV of all future cash flows is 0. Therefore, only those projects with an IRR greater than the minimum required rate of return should be pursued.
As with net present value functions, the internal rate of return function has several iterations. The standard internal rate of return calculation is performed using the =IRR function. But =XIRR takes dates into account and is, therefore, more accurate.
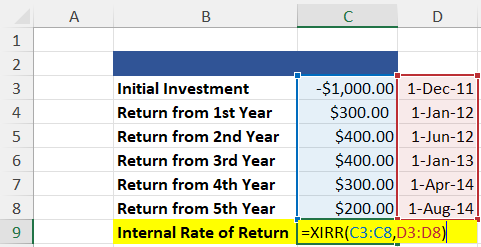
=XIRR(Values, Dates)
=60.27%
3. Modified Internal Rate of Return (=MIRR)
The modified internal rate of return calculation is one step ahead of the standard internal rate of return calculation.
Whereas IRR calculations assume that a project’s cash flows are reinvested at the IRR, MIRR assumes that positive cash flows are reinvested at the firm’s cost of capital and that the initial outlays are financed at the firm’s financing cost.
These assumptions make MIRR more accurate than IRR.
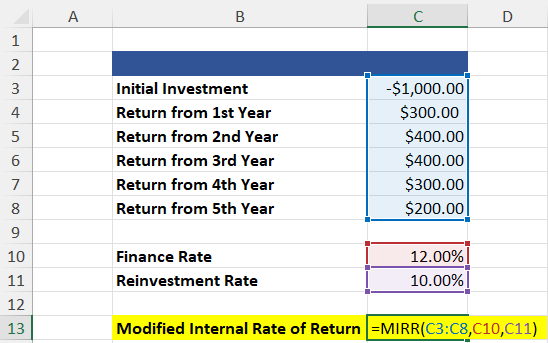
=MIRR(Values, Financing Rate, Reinvestment Rate)
=14.70%
IRR tends to overstate a project’s potential profitability, leading to capital budgeting mistakes based on the assumption that cash flows are reinvested at the IRR. Unfortunately, this assumption is overly optimistic. MIRR addresses this flaw.
Of course, a key component of accurate MIRR calculations is a reliable reinvestment rate, which is the cost of capital. However, computing a reliable estimate for a firm’s cost of capital can be tricky because the calculation can be subjective and may vary depending on the assumptions.
If you’re serious about starting a career in finance, a deep knowledge of Excel is a must. To help you get started, check out our Excel Modeling course. In this course, you’ll learn how Excel works and how you can make it work for you.


or Want to Sign up with your social account?