XNPV Function in Excel
Used to calculate the net present value (NPV) of an investment.


What Is The XNPV Function in Excel?
XNPV is a financial function in Excel used to calculate the net present value (NPV) of an investment. It discounts non-periodic cash flows received on specific dates.
If you are an investor or an analyst looking to value different potential investments, then this function in Excel is the right tool. This function is available in all versions of Excel from 2003 to 2019 and Excel 365.
It is a built-in Excel function that will return the net present value (NPV) based on non-periodic future cash flows discounted to the present value.
Calculating NPV helps determine whether to invest in a particular asset/project or explore other opportunities. Investors use NPV to make crucial decisions about significant capital investments.
In such cases, NPV is one of the essential tools to check the profitability of cash-flow-generating assets. Large corporations calculate NPV during business expansions and for various capital budgeting decisions.
- XNPV is an Excel financial function used to calculate an investment's net present value (NPV) by discounting non-periodic cash flows received on specific dates.
- Investors and analysts can leverage the XNPV function to evaluate potential investments. It is a built-in Excel function available in versions from 2003 to 2019 and Excel 365.
- NPV, calculated using XNPV, plays a crucial role in investment decisions, helping assess the profitability of cash-flow-generating assets. Large corporations use NPV for significant capital investments and expansions.
- XNPV offers precision in NPV results by considering the exact dates of cash flows. It provides faster and more accurate calculations than manual methods or the NPV function. It is especially useful for analyzing investments with irregularly timed cash flows.
What is Net Present Value (NPV)
NPV, or net present value, is the difference between future cash inflows and outflows, discounted to the present, considering the time value of money.
To understand better, let's see an example - Assume that you make an investment worth $10,000 that generates the following cash flows:
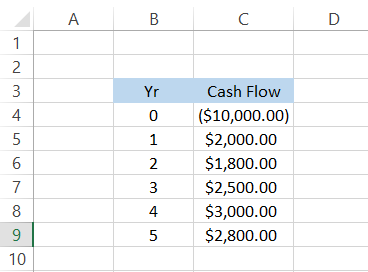
However, future cash flows are not an appropriate measure for checking the profitability of an investment. Currently, the cash inflows generated against a $10,000 investment are equal to $12,100.
The profit of $2,100 doesn't seem that bad; however, $2,100 after five years is worth less than $2,100 today.
A few factors contribute to the dollar losing its value over time, including inflation, opportunity cost, risk, etc. Hence, the cash flows are discounted to their present value using a discount rate.
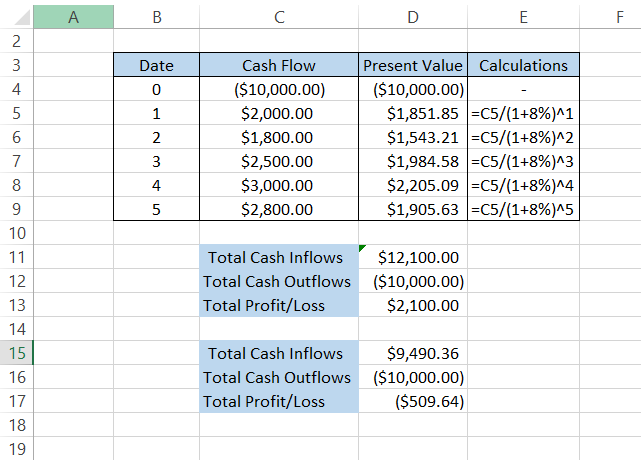
Alternatively, the time value of money also states that "a dollar today is worth more than a dollar in the future." By assuming that our discount rate is equal to 8%, the future cash inflows become:
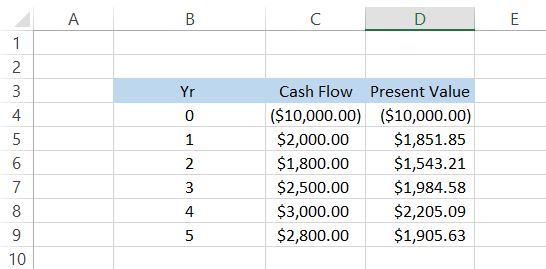
See the massive difference in the cash flows? Initially, we were expecting $2,800 in the fifth year; however, after discounting the cash flow to its present value, we will get just $1,905.63.
Summing up all the cash inflows, we have $9,490.36, which falls short of recovering our entire principal of $10,000 after five years.
We still fall $509.64 short of recovering our entire principal of $10,000. You can see the difference in the profits with regular and discounted cash flows illustrated below:
Note
We have put down the manual calculations to help explain how to derive the net present value from the cash flows. If you use the function, you don’t need to make all these calculations to get the NPV for an investment.
Interpretation of the Net Present Value
We calculated the net present value by subtracting the cash outflows from the cash inflows. The question that arises is, what would you do? Would you make the investment knowing that it might not even return the initial investment at the end of five years?
Absolutely not! When NPV is negative, the project should be rejected immediately as it does not generate value for the investor. However, if the NPV is positive, you can proceed with the investment.
Another scenario - What would you do if a $10,000 investment returns net present cash inflows equalling $10,010? The investment's net present value would equal a mere $10. Would you go ahead and invest?
Well, it depends entirely on you. An investment is acceptable as long as the NPV is positive. In the end, $10 is much better than having nothing at all! It still adds value to the investor's portfolio.
Example of the XNPV Function in Excel
The function is straightforward to use. If it weren't for the function, the manual calculations to determine the present value of cash flows would be time-consuming. We will review some examples of the function to understand it better.
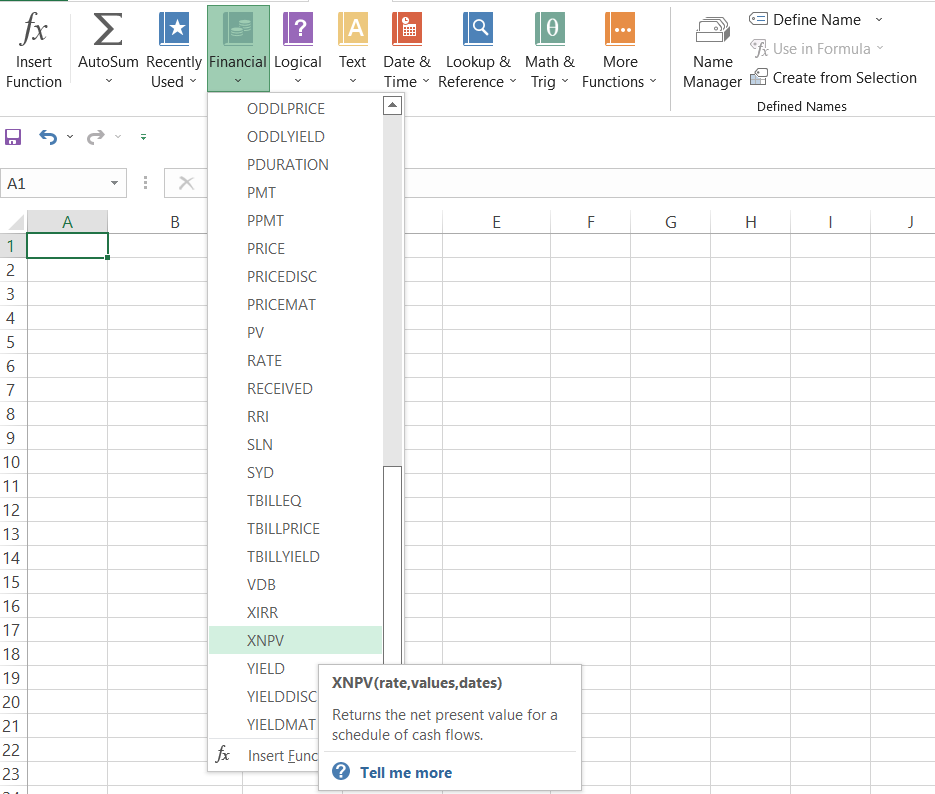
The syntax for the function is:
=XNPV(rate, values, dates)
Where,
- rate = the discount rate that will be applied to the cash flows. This is a required argument.
- values = the range of cells that represent cash inflows and cash outflows. This is a required argument.
- dates = the range of cells that show dates corresponding to cash inflows and cash outflows. This is a required argument.
Example 1
Let's assume that, as the CEO of XYZ Bank, you identify a possible company to acquire for $100,000. The company will generate cash inflows discounted to the present value for the bank, as illustrated below:
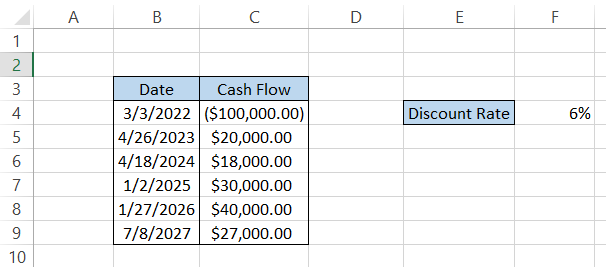
Here, we won't be calculating the present value of the cash flows. Instead, excel's XNPV function automatically does it for you using the discount rate you input into the formula.
To calculate the net present value, use the formula in cell C11 as =XNPV(F4, C4:C9, B4:B9). This will give you a result of $11,657.17.
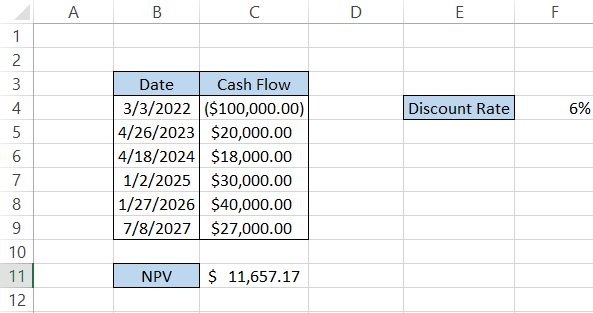
This is the difference between our cash outflow, i.e., $100,000, and the present value of all the cash inflows for five years. Therefore, since NPV is positive, the investment is profitable, and we can proceed with its purchase.
Example 2
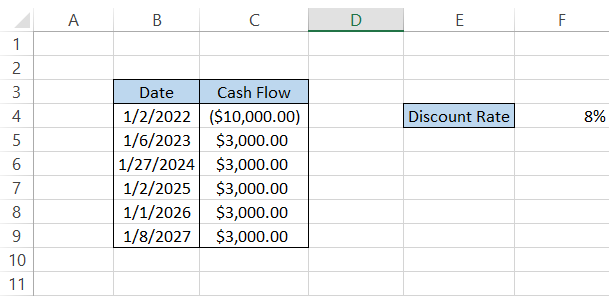
Let's assume that a project generates $3,000 of cash inflows yearly for an initial investment of $10,000. The cash inflows mostly occur in January, as illustrated below:
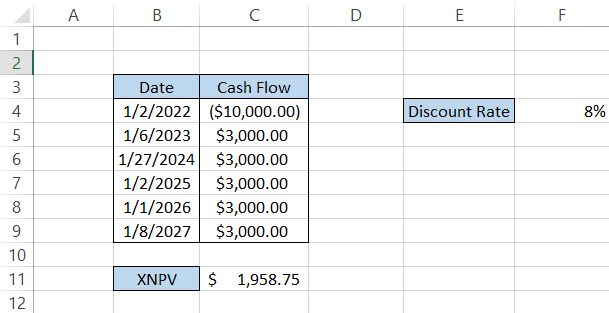
To calculate the net present value(NPV), we will use the formula =XNPV(F4, C4:C9, B4:B9), giving us the result illustrated below:
XNPV vs. NPV
As the XNPV function calculates the net present value for non-periodic cash flows from an investment in Excel, a similar function, NPV, calculates the net present value for periodic/equal cash flows. That's it; that's the difference between the two functions.
The syntax for the NPV function is:
=NPV(rate, values)
where,
- rate = the discount rate that will be applied to the cash flows. This is a required argument.
- values = the range of cells that represent cash inflows and cash outflows. This is a required argument.
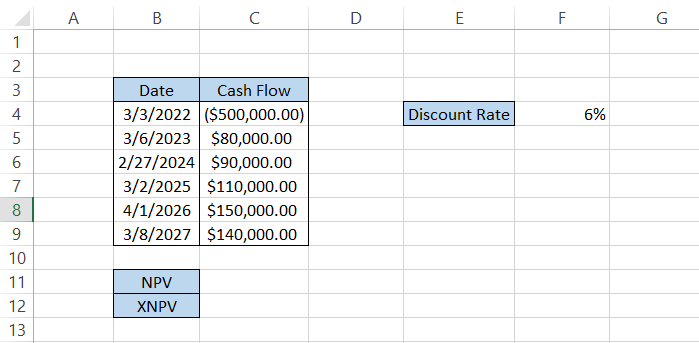
What happens when we use the XNPV and NPV functions for the same data set? Let's find out. Assume that company ABC intends to acquire another company, X, for $500,000. The expected cash flows over five years are:
To calculate cash flows as periodic income streams, we will ignore the dates in column B. The formula you will use in cell C11 is =NPV(F4, C4:C9), giving the result of $32,692.75.
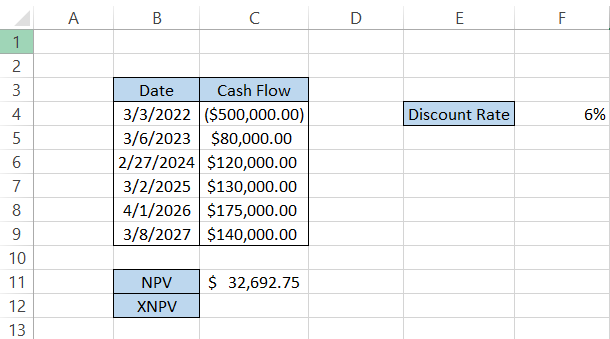
This method avoids changing cash flows to their present values and finding their differences. Instead, the computer does it all for you!
Similarly, to find the NPV for non-periodic cash flows, we will consider the dates in column B, making our formula =XNPV(F4, C4:C9, B4:B9), giving the result illustrated below:
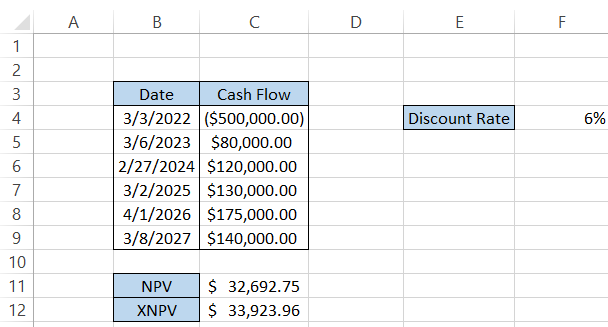
We have used the same discount rate and made no changes in the cash inflows or outflows, yet we have a difference of $1,231.21 between the two values. What could be the reason behind this?
The answer is quite simple.
The NPV function assumes that the cash inflows in the future are made 365 days away (one year). For example, if today's date is 3rd March 2022, the first cash inflow will occur on 3rd March 2023 for $80,000. The second cash inflow will occur on 3rd March 2024, for $120,000, and so on.
However, in contrast, when we use the XNPV function, we expect Excel to calculate the present value using the date we provided in the spreadsheet.
We had a cash flow of $175,000, which took more than a year, while another cash flow of $120,000 was received earlier than expected. Due to such fluctuations, the XNPV calculated is slightly higher than the NPV.
Why Use the XNPV Function in Excel?
There are several reasons you should prefer using the XNPV function in Excel rather than making manual calculations or the NPV function. Some of them are:
1. Precision
The XNPV function's primary benefit is the result's precision for net present value.
The function uses the exact dates on which the cash flows occurred, unlike the NPV function, which assumes cash flows occur every 365 days. For example, if the first cash inflow is on 3rd March 2022, the next is assumed to be on 3rd March 2023.
A lot of capital is employed in different investments, meaning that determining the correct return on investment is essential to making effective decisions.
2. Faster calculations
Using a function with just three arguments is faster than manually calculating the present value of cash flows and then determining the NPV. Manual calculations also carry a higher risk of errors.
3. Identifying cash flows at varying times
"In real-life scenarios, cash flows can be irregularly timed. It's unrealistic to expect cash inflows to occur every year on the same day of each month. Some organizations expect cash flows at the end of the year; some expect them at the beginning of the year; others may have them throughout the year.
Hence, you can correctly time cash flows using the function, calculating an investment opportunity's net present value.


or Want to Sign up with your social account?