Evening Star Pattern
A three candlesticks formation that is - a large green candle, a Doji, and, finally, a red candlestick.


What is the Evening Star Pattern?
An evening star is a technical indicator represented by three candlesticks: a large green candle, a Doji, and, finally, a red candlestick.
It has a bearish candlestick pattern. This pattern is seen in a candlestick chart of an asset price. It is one of the reliable indicators used in technical analysis and gives strong trend reversals in the market.
It is a pattern of three candlesticks that evolved during three trading sessions (days). It is usually observed at the top of an uptrend, which further results in reversals in the market and leads to a downtrend/bearish trend.
It is a common technical indicator widely used by analysts in forex trading. Unfortunately, it is scarce to find this pattern, and If a trader observes this at the very start of a trend, they can have a profitable trade.
-
The Evening Star pattern is a bearish candlestick formation used in technical analysis to indicate a potential reversal in an uptrend. It consists of three candles: a large bullish candle, a small-bodied candle (star), and a large bearish candle.
-
The pattern begins with a strong bullish candle, followed by a small candle that gaps up, indicating indecision or a possible reversal. The third candle is a strong, bearish candle that closes below the midpoint of the first candle, confirming the reversal.
-
The Evening Star pattern suggests that the upward momentum is weakening, and sellers are starting to take control. It is considered a reliable signal that a downtrend may be imminent.
-
Traders often use the Evening Star pattern to set stop-loss orders above the high of the pattern to manage risk. This helps limit potential losses if the anticipated reversal does not occur.
Characteristics of the Evening Star
The characteristics are:
- This pattern is easy to identify
- Entry and exit points can be easily interpreted
- One of the common candlestick patterns used in technical analysis
- Generally used in forex trading
Evening Star Components
As discussed above, it is created by the formation of three candlesticks:
1. Long green candlestick
On the first day, a long green candlestick, also known as a bullish candlestick, is created. The long candle represents high positive momentum, which increases prices. This candle is closed near the day's high point.
2. Doji
The second candle formation is a Doji, also an indecisive candlestick. It should be a gap from the first candlestick formed, which means the current day's opening price should be greater than the previous day's closing price.
A small body represents a Doji, and its closing price and opening price are very close. It means a modest price increase slows down previous days' bullish/positive momentum.
3. Red Candlestick
This candle formed on the third day; it is also known as a bearish candlestick. It is generally a gap down from the previous day's candle. Therefore, its closing price is lower than the opening price.
After the formation of this candlestick, an evening star pattern is created, which gives selling signals.
Typically, reversals are seen in the market once this pattern is confirmed, which further results in a downtrend.
Generally, less attention is given to candle shadows while interpreting this pattern. The size of the candle shadow, also known as the wick of a candle, doesn't matter. Traders pay more attention to the body than a candle's shadow.
When to take a trade call
Let's understand when we can take a trade call:
- There should be the formation of a pattern during three trading sessions
- Day 1 - A long blue/green candle
- Day 2 - A doji or a spinning top with a gap-up opening
- Day 3 - A red candle with a gap-down opening.
- Trade can be executed on the closing time of day 3
- Some traders wait till the 4th day, as the formation of the red candle on the 4th day can increase the chances of the market going bearish.
- Stop loss is generally set at the highest high on day 1, day 2, or day 3.
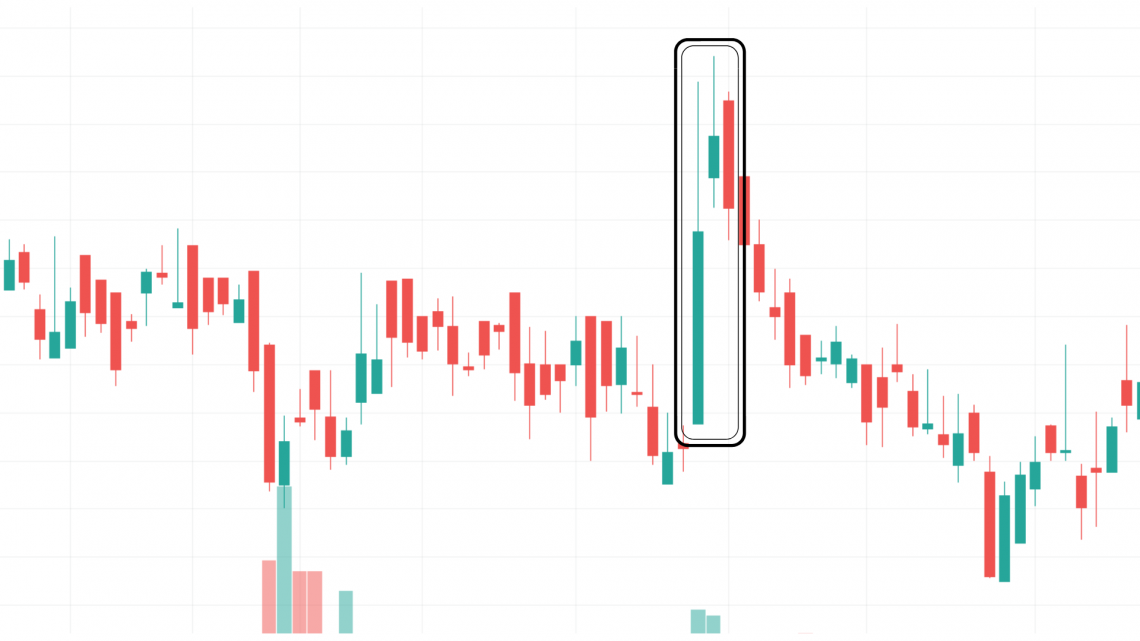
Representation Of Evening Star
Here, an evening star pattern in this chart is represented by three candles - a long green candle, a Doji/ spinning top, and a red candlestick. After the formation of this pattern, there are reversals in the markets, and a downtrend is seen after that.
A long green candle indicates high purchasing pressure/positive momentum, resulting in the rising security price. A Doji represents indecision in the market, as no particular trend/signals can be interpreted after a Doji formation. It slows down the previous day's momentum.
A long red candlestick represents selling pressure/negative momentum is high, resulting in a fall in the price of a security. There is an expectation that bulls will continue to panic, and negative momentum will prevail for the next few days. Therefore, one should look for selling opportunities.
For more information, you can refer to this YouTube video.
Evening star, morning star, and Forex
The evening star is one of the common patterns used in forex trading. It helps to recognize entry-exit positions while trading. Generally, traders use a combination of candlestick patterns and indicators to get better profits.
For a better understanding, you can refer to this YouTube video.
The evening star pattern is used not only in forex but also in intraday and swing trading. Therefore, it should be assessed with current trends and supporting evidence like RSI and MACD indicators.
Evening Star and Morning Star Pattern
The morning star is represented by three candlesticks - a red candle, a Doji, and a green candle - formed during three trading sessions. It is observed at the end of a downtrend. It is a bullish candlestick pattern. After this pattern's formation, reversals are generally seen, leading to an uptrend in the asset pricing chart.
While on the other hand, the evening star is a bearish candlestick pattern that leads to a downtrend.
Evening Star Pattern FAQs
Sometimes, results can be quite the opposite of what is expected from the evening star. So, to be on the safer side, one should look for a combination of indicators and candlestick patterns to get better results.
They don't always mean reversals and downtrends in the market; sometimes, prices could also go up.
It analyzes stock chart patterns and trends using technical indicators like MACD, RSI, and Bollinger Bands. By using these indicators, as well as considering price movements and trends, analysts can make informed trading decisions.
It represents asset price movements. A candlestick is a structure with four points representing open, high, low, and close prices and is commonly used in technical analysis.
It's a candlestick pattern where the closing price is lower than the opening price. It creates negative momentum and can lead to a further downtrend.
It's a candlestick pattern where the closing price is higher than the opening price. It creates positive momentum in the market and can lead to a further uptrend.

Free Resources
To continue learning and advancing your career, check out these additional helpful WSO resources:


or Want to Sign up with your social account?