MACD Oscillator – Technical Analysis
A technical analysis tool that depicts the link between two moving averages of a security's price.


What is the MACD Oscillator?
The Moving Average Convergence Divergence (MACD) Oscillator is a technical analysis tool that depicts the link between two moving averages of a security's price. It is a trend-following momentum indicator.
Technical analysis is a trading discipline that analyzes statistical trends from trading activity, such as price movement and volume, to evaluate investments and uncover trading opportunities.
The focus of technical analysis, as opposed to fundamental analysis, is on price and volume.
The goal of fundamental analysis is to determine the value of a security based on company performance, such as sales and earnings.
Hundreds of patterns and signals have been generated by researchers to enhance technical analysis trading across the discipline. Technical analysts have devised various trading methods to foresee and trade market fluctuations.
- The MACD (Moving Average Convergence Divergence) oscillator is a trend-following momentum indicator used in technical analysis to identify changes in the strength, direction, momentum, and duration of a trend in a stock's price.
- A common trading signal is generated when the MACD line crosses above the signal line, indicating a potential buy signal, or when it crosses below the signal line, indicating a potential sell signal.
- The MACD oscillator is valuable for identifying the strength and direction of a trend, helping traders to spot potential entry and exit points based on momentum shifts.
- The MACD can produce false signals in volatile or sideways markets due to its reliance on moving averages, which are lagging indicators. This lag can result in delayed signals in rapidly changing market conditions.
What is Moving Average Convergence Divergence (MACD)?
12 Period EMA - 26 Period EMA
An exponential moving average (EMA) is a sort of moving average (MA) that gives the most recent data points more weight and relevance.
The exponential moving average is also known as the exponentially weighted moving average.
An exponentially weighted moving average reacts more strongly to recent price fluctuations than a simple moving average (SMA), which assigns equal weight to all observations in the period (EWMA).
The result of the formula above is the MACD line. The "signal line," a nine-day EMA of the MACD, is then placed on top of the MACD line, which can act as a trigger for buy and sell signals.
When it crosses above its signal line, traders can purchase (or long) the security; when it crosses below the signal line, they can sell (or short) the shield.
MACD line movements can be interpreted in various ways, although crossings, divergences, and quick rises/falls are the most popular indicators.
Why is MACD considered a lagging indicator?
The indicator's data is based on the stock's historical price activity. On the other hand, some traders employ moving average convergence divergence histograms to anticipate when a trend will shift.
This element may be a leading predictor of future trend shifts by these traders. Hence it is considered a lagging indicator.
Breaking down the MACD indicator
A moving average convergence divergence chart typically has three numbers to establish the parameters.
The first is the number of periods used in calculating the faster-moving average. The second is the number of periods used to calculate the slower-moving average.
The third is the number of bars utilized to construct the moving average of the difference between the faster and slower moving averages.
For example, if the moving average convergence divergence parameters were "12, 26, 9" (which is usually the default value for most charting software), you would read it as follows:

- A moving average of the last 12 bars is represented by the number 12.
- A moving average of the last 26 bars is represented by the number 26.
- The 9 indicates the difference between the two moving averages above as a moving average.
When it comes to the lines on the chart, there is a widespread misunderstanding. There are two lines in total:
- The "MACD Line" (Blue Line)
- The "Signal Line" (Orange Line)
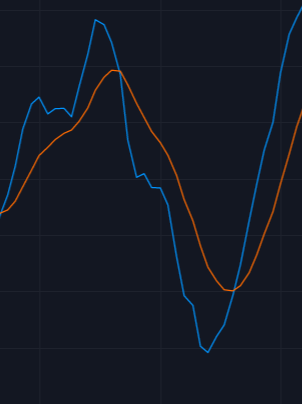
The difference (or distance) between two moving averages is the MACD Line. These two moving averages are almost always exponential moving averages (EMAs). When looking at the indicator, the MACD Line is the "faster" moving average.
The signal line is the moving average convergence divergence line's moving average. When looking at the indicator, the signal line is the "slower" and less volatile moving average.
The slower-moving average shows the average of the preceding MACD Line. As in the last example, this would be a 9-period moving average. Most charts use a 9-period exponential moving average (EMA) by default.
This means we're using the average of the previous nine periods of the "faster" MACD Line as our "slower" moving average (signal line).
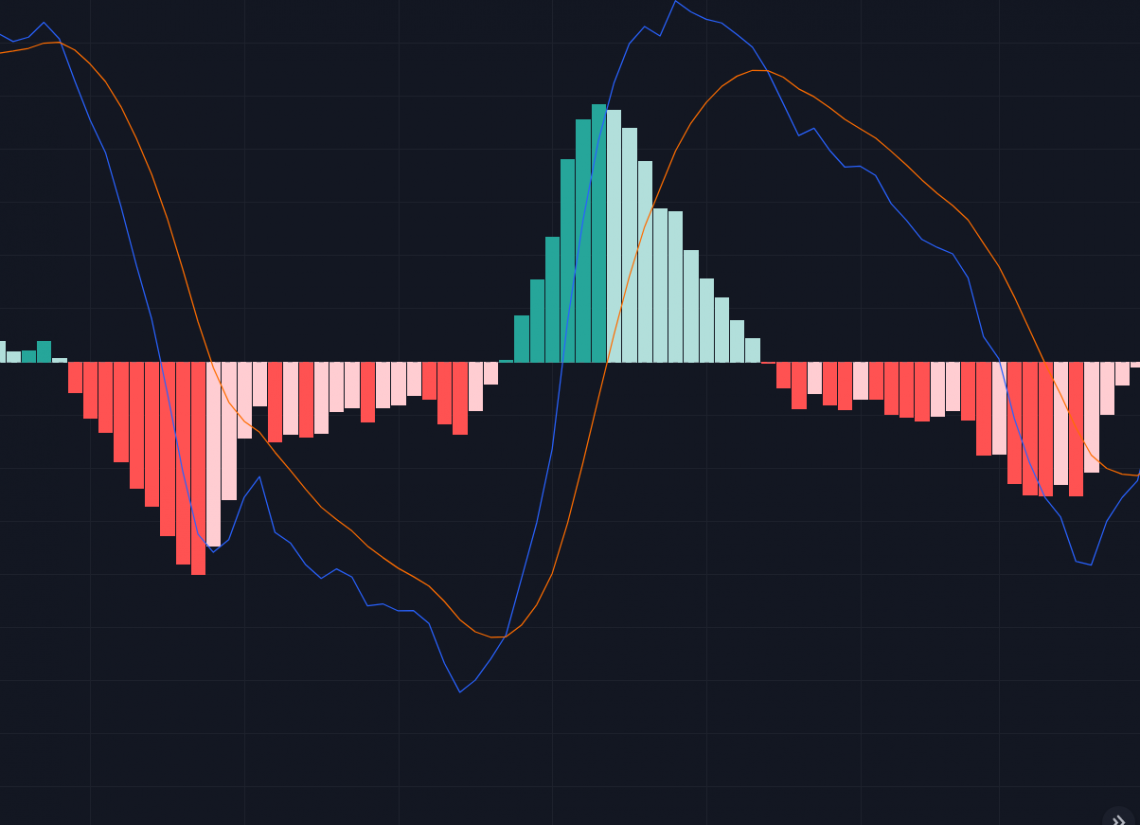
The difference between the moving average convergence divergence line and the signal line is represented in the histogram. This chart is a graphical depiction of how far apart the two lines are. It may occasionally warn you that a crossover is on the way.
The histogram becomes more prominent when the two moving averages are split. Because the faster-moving average (MACD line) is "diverging" or moving away from the slower-moving average (signal line), this is known as a divergence.
The histogram shrinks as the moving averages come closer to each other. Because the faster-moving standard is "converging" or becoming closer to the slower-moving average.
How this indicator works
A bullish moving average convergence crossing above zero is considered bullish, whereas a bearish moving average divergence crossing below zero is considered bearish.
Second, it is deemed bullish when the moving average convergence divergence rises from below zero. Conversely, it is considered bearish when it falls from above zero.
-
The indicator is bullish when the moving average convergence divergence line crosses from below to above the signal line. The stronger the signal, the lower it goes below the zero line.
-
The indicator is deemed bearish when the MACD line crosses from above to below the signal line. The signal becomes stronger as it rises over the zero line.
-
The moving average convergence divergence whipsaws during trading ranges, with the short line crossing back and forth over the signal line. In this circumstance, indicator users often avoid trading or cancel positions to limit portfolio volatility.
-
When the moving average convergence divergence and price action diverge, it is a stronger indication that validates the crossing signals.
Signals of the mACD Indicator
The signals can be seen as:
1. Signal Line Crossovers
The most typical signals are signal line crossings. The signal line is a 9-day EMA of the moving average convergence divergence line.
It trails the MACD as a moving average of the indicator, making it more straightforward to notice the turns made by the moving average convergence divergence.
It is considered a bullish crossing when it rises and crosses above the signal line. Conversely, when it turns down and crosses below the signal line, it is regarded as a bearish crossing.
Depending on the power of the exercise, crossovers might endure a few days or weeks.
Chartists can estimate historical extremes using a simple visual examination without upper and lower limits on the moving average convergence divergence.
A big move in the underlying security is required to propel momentum to extremes.
Even if the movement continues, velocity will likely reduce, resulting in a signal line crossing at the extremes. The underlying security's volatility might also increase the frequency of crossings.
2. Centerline Crossovers
The second most prevalent moving average convergence divergence signal is centerline crossover. When the MACD line crosses above the zero line to become positive, it is known as a bullish centerline crossing. This occurs when the underlying security's 12-day EMA exceeds the 26-day EMA.
When the moving average convergence divergence crosses below the zero line and becomes negative, it is known as a bearish centerline crossing. When the 12-day EMA falls below the 26-day EMA, this occurs.
Depending on the trend's strength, centerline crossings might last a few days or months. As long as there is a continuous upswing, it will remain positive. Conversely, when there is a long-term decline, it will remain negative.
3. Divergences
A divergence occurs when the indicator diverges from the underlying asset's price behavior. For example, when security hits a low and MACD makes a higher low, the result is a bullish divergence.
The security's lower low confirms the current downtrend, while the MACD's higher low indicates less negative momentum.
As long as it is in negative territory, downward momentum continues to outpace the upside. Conversely, slowing negative momentum might indicate a trend reversal or a significant rebound.
Even though the uptrend is continuing, it is moving at a slower speed, causing the moving average convergence divergence to fall from its highs.
Although upward momentum is not as powerful as it once was, it will continue to outperform downward momentum as long as the MACD line remains above zero. At the start of a significant downtrend, the reverse occurs.
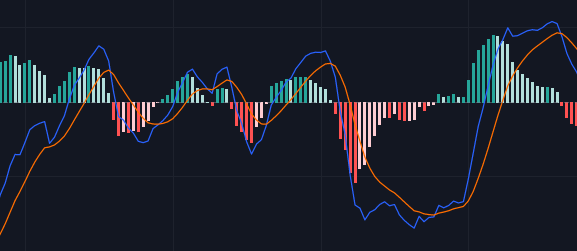
Reading the Histogram
The moving average convergence divergence histogram bars depict the difference between the MACD and signal lines.
The moving average convergence divergence histogram is essentially an indicator of indicators and is one step ahead of the signal line crossing!
Traders should pay attention when the slope of the Histogram changes.
A possible sell signal to a trader is when the Histogram rises and decreases (blue bars), which occurs before the "sell" signal line crossing. When the Histogram dips and increases (blue bars), it's a possible purchase signal.
MACD Oscillator vs. Relative Strength Index (RSI)
The relative strength index (RSI) determines if a market is overbought or oversold based on current price levels. The RSI is a price oscillator that measures average price gains and losses over time. With values ranging from 0 to 100, the default period is 14.
The moving average convergence divergence evaluates the connection between two exponential moving averages (EMAs), whereas the RSI monitors price movement regarding previous highs and lows.
These two indicators are frequently used to provide analysts with a more comprehensive technical picture of a market.
Both indicators reflect market momentum, but they can occasionally offer contradictory results because they assess distinct parameters.
The RSI, for example, may display a value over 70 for a lengthy period, suggesting that the market is overextended to the buy-side about recent prices, while the other indicator indicates that the market is still gaining purchasing momentum.
By displaying divergence from price, any indicator may indicate an impending trend shift (price continues higher while the hand turns lower, or vice versa).
Advantages and Disadvantages of MACD Oscillator
Traders and analysts utilize the Moving Average Convergence Divergence (MACD) oscillator, one of the most well-liked and extensively employed technical analysis indicators, to determine market momentum.
Technical indicators are a tool used by traders and analysts to identify market patterns, predict future changes in the trading environment, and ultimately make profitable trades for themselves or by advising clients on how to make profitable trades.
Below are some of the advantages and disadvantages listed below:
Advantages
- The numerous indications given by this measurement are simple to comprehend, as seen in the preceding instances, and may be swiftly incorporated into any short-term trading plan.
- At its most basic level, an indicator is a unique tool for traders to guarantee that short-term direction is working in their favor.
Disadvantages
- The most significant downside of utilizing this indicator to produce transaction signals is that a trader may be whipsawed in and out of a position numerous times before capturing a substantial shift in momentum.
- The lagging feature of this indicator can create many transaction signals over a protracted rise, causing the trader to make a series of tiny wins or even losses throughout the rally.
- The whipsaw effect can be vital in trending and range-bound markets since modest changes can quickly lead the indicator to flip directions. A considerable number of erroneous signals might cause a trader to lose money.
- When commissions are considered, this method might quickly become prohibitively expensive.
- When comparing a variety of assets, the moving average convergence divergence reading for different valued equities gives little insight because it is the dollar value between the two moving averages.
- Many technical analysts may employ the percentage price oscillator to solve this dilemma, which is generated in the same way as the MACD but looks at the % difference between the moving averages rather than the dollar amount.

Free Resources
To continue learning and advancing your career, check out these additional helpful WSO resources:


or Want to Sign up with your social account?