Exponential Moving Average (EMA)
A type of moving average that represents changes in the price of a security in a specified time period.


What is the Exponential Moving Average (EMA)?
Exponential Moving Average (EMA) is a type of moving average that represents changes in the price of a security in a specified time period. But unlike a simple moving average (SMA), EMA gives more emphasis/weight to the recent data (recent prices) than historical data.
Exponential moving average (EMA) is one of the widely used indicators in technical analysis.
Poor indicators can create confusion and disarrangement, so using and interpreting them correctly with proper understanding and knowledge is advisable. It is a lagging indicator that gives signals after the happening of an event and represents the trend based on the stock price.
The primary objective of this indicator is to identify trends and determine resistance and support bands. Short as well as long-term trading decisions can be made from this indicator.
12 and 26-day Exponential moving averages are used to create indicators like MACD- moving average convergence and divergence and PPO- percentage price oscillator.
A combination of technical indicators and patterns is used to interpret price trends and market situations better. For example, when there is a bull market and a strong uptrend, the exponential moving average will go up and vice versa.
Traders use different EMA lengths for trading sessions like ten days, 50 days, 100 days, and so on.
- The Exponential Moving Average (EMA) gives more weight to recent data, making it more responsive than the Simple Moving Average (SMA).
- The EMA is calculated by applying a multiplier to the most recent price, which is then added to the previous EMA value. This formula incorporates a smoothing factor that determines the weight of the most recent price.
- Due to its weighting mechanism, the EMA reacts more quickly to price changes than the SMA. This sensitivity makes it useful for identifying short-term trends and potential reversals.
- The EMA is effective in identifying trends but can produce false signals in choppy markets. Traders often use additional indicators to confirm EMA signals.
The Difference Between EMA and SMA
Exponential and simple moving averages are common technical indicators that technical analysts use.
They both help predict market trends, which further helps determine the resistance and support levels.
They both are lagging indicators that use past data to generate a trend line for a stock's price.
The SMA formula is straightforward; you have to divide the sum of observations by the number of observations and give equal weights to all values.
It gives more weight to recent price data and responds to the latest price change faster than older prices.
It depends upon one's trading strategy; we can't distinguish them as one is a better indicator than the other.
To get more information, you can refer to this YouTube video.
Calculating the Exponential Moving Average
It can be calculated by following three steps which are as follows:
Step 1 - Calculation of simple moving average:
SMA can be calculated very easily with the help of the given formula-
(Sum of closing prices of the specified time period) / (Number of observations)
To calculate the SMA for the last 20 trading days, you need to divide the sum of closing prices of all 20 days by 20( i.e., the number of observations).
Step 2 - Calculation of Multiplier:
The second step involves the calculation of the multiplier, which is given by the formula -
Multiplier = {2 / (Total number of observations + 1)}
As in the above example, we had taken the data for 20 days, so after applying this given formula, the value of the multiplier will be 2/21=0.09523, equal to 9.523%.
Step 3 - Calculation of exponential moving average:
The last step is to determine the value of the exponential moving average, which the formula can calculate -
EMA = {Closing price of the stock * Multiplier} + {previous day’s EMA * (1 - Multiplier)}
As it gives more weight to recent data, it responds to changes in price faster than SMA.
Exponential Moving Average Advantages
The advantages are:
1. It identifies and confirms market trends
Market trends are broadly classified into three categories, i.e., uptrend, downtrend, and sideways movement. Traders use a combination of patterns and trendlines to identify long and short positions in the market.
When the EMA line goes in the upward direction, it represents the uptrend, whereas when it goes in the downward trend and represents the downtrend.
Also, when it is above the asset's current market price, it will result in a downtrend in the market, which further leads to a decrease in the stock price.
2. Determine support and resistance levels
It can help to determine the support and resistance levels for the price of financial security. Support level/band is the predetermined price of the asset beyond which it cannot fall. It is also known as the floor price.
The resistance level/band is the predetermined price of the asset beyond which it cannot rise. It is also known as the ceiling price.
3. More sensitive
It is more sensitive to price changes than a simple moving average (SMA).
It represents the rapid fluctuation in the price of financial security, which further helps to identify trends.
For Example
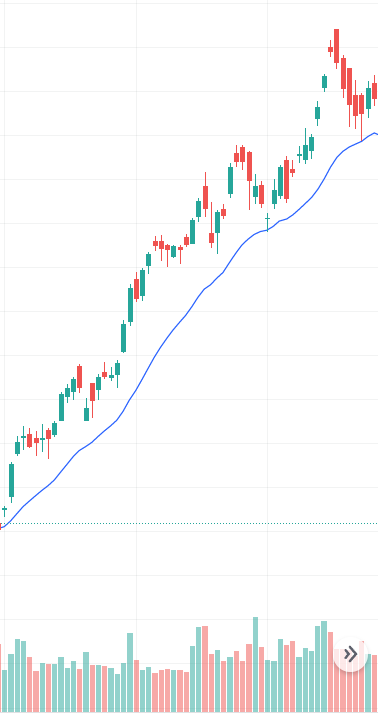
Here you can see this graph; the blue line represents 21 days EMA acting as a floor price. Hence the price is not expected to fall below the support level (floor price).
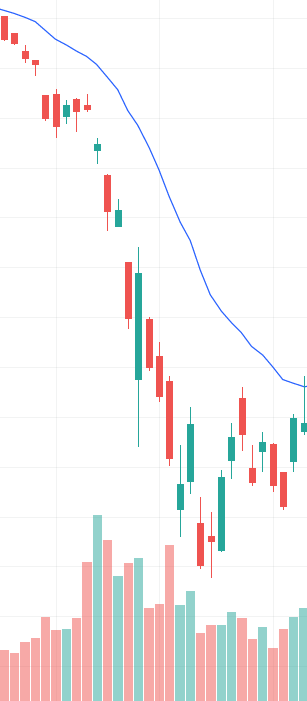
Again, the blue line represents 21 days EMA acting as a ceiling price. Hence the price is not expected to exceed the resistance level (ceiling price).
EMA Crossovers in Swing Trading
Swing traders often combine two or more Exponential moving averages to make better trade calls. This is because shorter EMA (with a short time span) reacts faster than longer EMA (with a long time span).
When the faster EMA crosses and is above the slower EMA, it results in a bullish market or uptrend; one can go for long positions. Similarly, When the faster EMA crosses start going below slower EMA, it results in a bearish market or downtrend; one can go for short positions.
Some of the combinations of Exponential moving average crossover which are popularly used in swing trading are as follows:
- Nine days EMA with 21 Days EMA - It is used to identify short-term trades that last up to a few trading sessions.
- Twenty-five days EMA with 50 Days EMA - It is used to identify medium-term trades that last up to a few weeks.
- Fifty days EMA with 100 Days EMA - It is used to identify trades that last up to a few months.
- One hundred days EMA with 200 Days EMA - It is used to identify long-term trades that last for a year or more. It is used more for investment rather than for trading purposes.
The longer the time frame one chooses for a crossover system, the lesser the trading signals.
Exponential Moving Average (EMA) FAQs
Although exponential moving average offers more weight to current price changes, giving more emphasis to recent data can sometimes bring false alarms and create havoc in the system.
Traders also use exponential moving average lengths for trading sessions like 10 days, 50 days, 100 days, etc.
Depending on how they use these indicators, traders have different strategies and techniques.
It is calculated by using the formula -
EMA = {closing price of the stock* multiplier} + {Previous day’s EMA * (1 - Multiplier)}

Free Resources
To continue learning and advancing your career, check out these additional helpful WSO resources:


or Want to Sign up with your social account?