Q Ratio
A company's market value divided by its assets' replacement cost


What is the Q Ratio?
The Q ratio, also known as Tobin's Q, is a company's market value divided by its assets' replacement cost. Equilibrium occurs when market value equals replacement cost.
The ratio conveys the relationship between market valuation and intrinsic value. In other words, it determines whether a particular business or market is over or undervalued.
This ratio was developed by James Tobin, an economist and Nobel laureate, and is used in acquisitions, mergers, and other valuation models to evaluate a company's true worth.
It evaluates a company to determine whether its securities are over or underpriced. In addition, it is often used when determining the actual value of a company during Mergers & Acquisitions (M&A) deals.
It is also used to calculate the value of a firm's goodwill. If the ratio is more significant than one, the company has a charity and is valued well.
The ratio measures an organization's assets to its market value and determines how over/undervalued a particular stock market segment is.
Key Takeaways
-
The Q ratio, or Tobin's Q, is the market value divided by the replacement cost of a company's assets, with equilibrium occurring when these values are equal.
-
Developed by economist James Tobin, the ratio is used in acquisitions, mergers, and valuations to assess a company's true worth and to determine if securities are over or underpriced.
-
A low ratio (0-1) implies undervaluation, while a high ratio (>1) suggests overvaluation. It's a key factor in investment strategies, helping assess whether the market is overbought or undervalued.
Interpretation of Q Ratio
Tobin's Q is a quotient popularized by Nobel laureate in economics James Tobin of Yale University. He hypothesized that the combined market value of all companies on the stock market should be roughly equal to their replacement costs.
While Tobin is often credited with inventing it, economist Nicholas Kaldor first proposed it in an academic publication in 1966. As a result, the ratio is sometimes referred to as "Kaldor's V" in older texts.
A low ratio (between 0 and 1) indicates that the cost of replacing a company's assets exceeds the value of its stock. This means the stock is undervalued.
On the other hand, a high ratio (greater than 1) indicates that a firm's stock is costlier than the replacement value of its assets, implying that the stock is overvalued.
Some investment strategies use Tobin's Q ratio as the driving factor behind decision-making. When applied to the entire market, we can determine whether it is relatively overbought or undervalued.
According to the ratio, a business is intrinsically worth what it costs to replace. Therefore, the cost of replacing a company is its replacement value.
It may appear logical that a ratio of 1.0 represents fair market value. However, this has not always been the case. Before 1995, the Q ratio in the United States had never reached 1.0. The Q ratio peaked at 2.15 in the first quarter of 2000 and at 0.66 in the first quarter of 2009.
Formula of the Q Ratio
The ratio can be calculated as the total market value of a company divided by its total assets.
It can be represented as:
Q ratio = 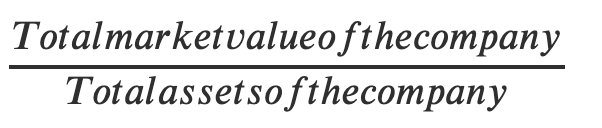
Because estimating the replacement cost of total assets is difficult, analysts frequently use another version of the formula to calculate this ratio:
Q ratio = (Equity market value + Liability market value) / (Equity book value + Liability book value)
Because market value typically does not fully account for a firm's liabilities, the assumption is made that the market value of liabilities and the book value of a company's liabilities are equivalent. This yields the following simplified version of Tobin's Q ratio:
Tobin’s Q =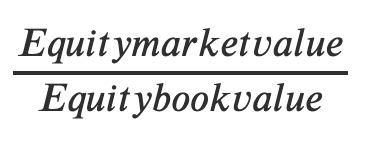
It can also be calculated as:
Q ratio = ![]()
Here, the market value of assets represents the current market value of all assets, whether movable or immovable. If all assets are sold today, the replacement cost indicates how much the company can collect.
Q Ratio Calculation
Let us take a few examples to understand its calculation better. Consider a company with a book value of assets equal to $50 million and 10 million total shares outstanding trading at $20/stake. Determine whether the company is undervalued or correctly priced using Tobin's Q.
Here, we know
Q ratio = Market value of firm / Market value of assets.
The market value of the firm = Total outstanding shares * Price per share
= 10 million * $20 = $200 million
Therefore, Q ratio = $200 million / $50 million = 4
As the ratio is greater than 1, the company is technically overpriced and enjoying benefits.
Replacement Value
Given its current market price, the cost of replacing an existing asset is referred to as replacement value. For example, even if a person paid $100 for the same storage space a few years ago, a one-terabyte hard drive's replacement value could be as low as $10.
In this case, determining the replacement value would be simple because there is a thriving market for hard drives from which to compare prices.
To determine the value of a one-terabyte hard drive, we simply need to calculate the cost of purchasing a one-terabyte hard drive from one of the many suppliers in the market. However, in many cases, the replacement value of assets can be far more elusive.
Consider a company that has complex software explicitly designed for its operations. Due to its highly specialized nature, there may be no comparable alternatives on the market.
In contrast to the previous case, one cannot simply check how much similar software is selling for because such software does not exist. As a result, determining an objective estimate of the software's replacement value would be difficult, if not impossible.
Similar situations can arise in various business contexts, ranging from complicated industrial machinery and unknown financial assets to intangible assets like goodwill.
Because determining the replacement value of these assets and those that are similar is difficult, many investors do not consider this ratio a reliable valuation tool.
Effect on Capital Investment
Tobin's Q would be 1.0 if a company's market value perfectly reflected its recorded assets. However, if Q exceeds 1.0, the market value exceeds the value of the company's recorded assets. This implies that the market value reflects some of the company's unmeasured or unrecorded assets.
High Q values encourage businesses to invest more capital because it is "worth" more than the price.
Expression for Q based on capital investment can be represented as:
Q = market value of installed capital/replacement cost of capital
If a company's stock price is higher than the current replacement price, q > 1, the company can issue shares and invest the proceeds in capital, resulting in economic profit.
If, on the other hand, Q is less than one, the market value is less than the recorded value of the company's assets. This suggests that the market may be underpricing the company or that the company could boost profits by selling or declining to replace capital stock as it wears out.
When Q is less than equal, the market appears to be saying that the deployed tangible assets will not earn an adequate rate of return and that, as a result, the owners of such assets will have to accept a discount to the replacement value for shares of their firm.
If tangible assets can be sold at replacement cost, shareholders would benefit, and the ratio may rise back to parity.
Tobin's insights show that changes in stock prices are reflected in changes in consumption and investment. However, empirical evidence suggests that the relationship is not as tight as one might think.
This is largely because firms do not base fixed investment decisions solely on stock price movements; instead, they consider future interest rates and the present value of expected profits.
Applications of the Q Ratio
The ratio is mainly used to determine a company's value. If the balance is more significant than one, a company's market value exceeds the value of its booked assets. Because the market value includes some unmeasured or unrecorded assets, the company is overvalued.
A ratio greater than one indicates that a company's earnings potential exceeds the replacement costs of its assets. This may entice potential competitors to re-create the business model to reap profit.
The precision of the values obtained by accountants significantly impacts the ratio. Two essential items have a substantial impact on the matter but are frequently not precisely recorded by accountants:
1. Speculation in the market
Market speculation and hype frequently influence a company's value, but accountants cannot record them.
Events such as an analyst's assessment of the company's prospects or business rumors can affect market valuation but are not reflected in the company's records.
2. Intangible Assets
Intangible assets, such as intellectual property and goodwill, can be challenging to quantify and record. As a result, accountants typically record only a rough estimate of intellectual property or goodwill.
As a result, the analysis of a company's value using this ratio should account for the items above.
Q Ratio Advantages & Disadvantages
The Q ratio is the measure of a firm’s market value in comparison to its intrinsic value. This ratio has been used to assess a company's intangible assets.
The use of Q for measuring intangible value is built on the assumption that, given a Q value close to 1, the future equilibrium market value must be the same as the replacement value of its assets.
The benefit of using Tobin's Q is that it avoids the complicated issue of estimating either the rate of return or the marginal cost.
On the other hand, for Q to be meaningful, accurate measures of the market value and replacement cost of a firm's assets are required.
Below are some of the advantages and disadvantages of this ratio.
1. Advantages
- Helpful in determining actual net worth in M&A deals and other transactions.
- Useful in determining the value of an investment.
- The market's potential can be determined using the ratio.
- It is an efficient means of attracting foreign investment.
- This ratio can help identify market volatility to a certain extent.
2. Disadvantages
- It is calculated using market value, and the market is always known, implying that market conditions can change positively or negatively.
- When calculating the ratio, the true potential of the company is ignored.
- Due to the market value approach's calculation method, some businesses can be undervalued.
- Because of unique features or self-created assets, determining market value can be difficult.

Researched and authored by Kavya Sharma | LinkedIn
Free Resources
To continue learning and advancing your career, check out these additional helpful WSO resources:

or Want to Sign up with your social account?