The US equity markets are on a roll. Today, the S&P 500 hit an all time high, just weeks after the Dow also broke its record. While it has been less than five years since the crisis of 2008 and the epic collapse of equities in the last quarter of that year, the returns earned by those who stayed the course, even relative to pre-crisis price levels, is a testimonial to the dangers of staying out of equity markets for extended periods.
As with every other market surge, this one has brought with it the usual questions: Have stocks gone up too far, too fast? Are we due for a correction? Should we stay in the market or take profits? I could cop out and use the excuse that I am not a market timer, but that would be a lie. All investor are market timers, with the differences being one of degree. So, the honest truth is that I have a view about markets but that it does not dominate my investment decision process.
Since it is so easy to be swayed by story telling, when talking about equity markets, I try to bring the same tools to assessing markets that I do for individual stocks. The intrinsic value of equities, in the aggregate, is determined by four variables:
- Cash returned to equity investors: Ultimately, we buy stocks to get cash flows in return, with those cash flows evolving over the last three decades from almost entirely dividends to a mix of dividends and stock buybacks. Holding all else constant, the more cash that is returned to investors in the near term, the more you will be willing to pay for stocks.
- Expected growth: The bonus of investing in equity, as opposed to fixed income, is that you get to share in the growth that occurs in earnings and cash flows in future periods. Other things held equal, the higher the expected growth in earnings and expected cash flows, the higher stock prices should be.
- Risk free rate: The risk free rate operates as more than base from which you build expected returns as investors. It also represents what you would earn from investing in a guaranteed (or at least as close as you can get to guaranteed) investment instead of stocks. Consequently, stock prices should increase as the risk free rate decreases, if you hold all else fixed.
- Risk premium: Equities are risky and investors will demand a “premium” for investing in stocks. This premium will be shaped by investor perceptions of the macro economic risk that they face from investing in stocks. If the equity risk premium is the receptacle for all of the fears and hopes that equity investors have about the future, the lower that premium, the more they will be willing to pay for stocks.
Note that while it is easy to focus on each of these variables and draw conclusions about the impact on stock prices, they tend to move at the same time and often pull in different directions. For instance, stronger economic growth will push up earnings growth but interest rates will usually go up as well. In a similar vein, paying out more in cash flows to investors in the current period will often mean less being invested into businesses and lower growth in the future. It is the trade off that determines whether stock prices will go up or down as a consequence. On each of these variables, the US equity market is looking at "good" numbers right now: the cash returned to investors by US companies has rebounded strongly from post-crisis lows, earnings growth is reasonable, the risk free rate is at a historic low and the equity risk premium, while not quite at pre-crisis levels, has declined significantly over the last year. To explore both where we are and the potential dangers that we face as investors, let’s take a look at each variable.
1. Cash flows
a. Background: Until the early 1980s, the primary source of cash flows to equity investors in the United States was dividends. As I noted in this post from a while back, US companies have increasingly turned to returning cash in the form of buybacks. While there are some strict value investors who believe that dividends are qualitatively better than buybacks, because they are less volatile, the aggregate amount returned by US companies in buybacks is too large to be ignored.

b. Level: In the most recent twelve months for which data is available (through December 2012), the companies in the S&P 500 bought back almost $400 billion worth of stock, much more than the $270 billion that they paid out in dividends. In terms of index units and as a percent of the level of the index, the aggregate cash flows have recovered fully from their post-2008 swoon.
c. Sustainability: While it is good that cash flows are bouncing back, we should worry about whether companies were over reaching and paying out too much in 2012, perhaps in advance of the fiscal cliff at the end of 2012, in which case you should expect to see a drop off in cash flows in the near term. There are three reasons to believe that this is not the case. First, as Birinyi Associates notes in this blog post, the pace of buybacks is increasing in 2013, not dropping off, with the buybacks authorized in February 2013 at an all-time high. Second, the cash returned in 2012 may have been a historic high in dollar value terms, but as a percent of the index, it is close to the average yield over the last decade. Third, the aggregate cash balances at the S&P 500 company amounted to 10.66% of firm value at the end of 2012, suggesting that companies have cash on hand to sustain and perhaps even increase cash returned to stockholders. While a portion of this cash is trapped, it is possible that corporate tax reform, if it happens, will release this cash for distribution to stockholders.
2. Expected growth
a. Background: For dividends and buybacks to continue to grow in the future, there has to be growth in earnings. While that growth can be estimated by looking at history or by tracking analyst forecasts of earnings for the individual companies, it has to be earned by companies, reinvesting their earnings back into operations and generating a healthy return on equity on those investments.
Intrinsic growth rate = Equity Reinvestment Rate * Return on equity
Thus, while history can sometimes yield skewed values (up or down) on growth and analysts can become overly optimistic or pessimistic, the intrinsic growth rate will be grounded in reality.
b. Level: To look at earnings growth in the S&P 500, lets begin by looking at history. In the table below, we report on earnings growth rates over 5 years, 10 years, 20 years and 50 years in index earnings.
|
Arithmetic average
|
Geometric Average
|
|
|
Last 5 years
|
6.46%
|
4.42%
|
|
Last 10 years
|
9.66%
|
8.33%
|
|
Last 20 years
|
9.60%
|
8.28%
|
|
Last 50 years
|
8.30%
|
6.90%
|
Over the last 5 years, the compounded average annual growth rate in aggregate earnings for the S&P 500 has been 4.42%. As the most widely followed index in the world, analyst estimates of growth in earnings are widely available both for individual companies in the S&P 500 index and for aggregate earnings in the index. Using the former to construct a bottom-up estimate of growth yields 10.57% as the expected growth rate in March 2013. Since there is evidence that analyst estimates of growth are biased upwards at the company level, we also looked at the “top down” estimates of growth that analysts are forecasting for aggregate earnings in March 2013, obtaining a lower growth rate of 5.33% a year for the next 5 years.
c. Sustainability: Are analysts over estimating earnings growth? One way to check is to compute the intrinsic growth rate by computing the equity reinvestment rate and return on equity for the index. To compute the equity reinvestment rate, we use the aggregate cash returned to investors (75.31) in 2012 and the earnings on the S&P 500 (102.47) in 2012:
Equity Reinvestment Rate = 1 - 75.31/102.47 = 26.51%
To compute the return on equity on the index, we divide the aggregate earnings on the index in 2012 by the aggregate book value of equity on the index (613.14) at the start of 2012:
Return on equity = 102.47/613.14 = 16.71%
The product of the two yields a sustainable growth rate:
Sustainable growth rate = .2651 * .1671 = .0443 or 4.43%
While this number is lower than the top-down analyst estimate of growth, it is within shouting distance of the estimate. There is, of course, a concern that some investors and analysts have voiced about the operating earnings number reported for the S&P 500, arguing that it is over stated. If it is, then the equity reinvestment rate and ROE are both over stated, and the expected growth rate will be lower.
a. Background: Put simply, the equity risk premium is the market price of equity risk. It is determined on the one hand by perceptions of the macro risk that surround investors, with greater risks going with a higher ERP, and on the other hand by the collective risk aversion of investors, with more risk aversion translating into a larger ERP. A larger ERP implies that investors will pay lower prices for the same set of equity cash flows. The conventional wisdom that this number is stable in mature markets was shaken by the banking crisis of 2008, as premiums in the US and European equity markets experienced unprecedented volatility.
b. Level: There are two ways in which ERP can be estimated. One is to look at a long period of history and to estimate the premium that stocks would have generated, over an above the treasury bond rate, over that period. This “historical” premium approach yields 4.20% as the ERP for US stocks in 2013, using data from 1928-2012. The other is to estimate an “implied” premium, by backing out an internal rate of return from current stock prices and expected cash flows. This approach yields much more volatile equity risk premiums over time, as can be seen in the graph below:

c. Sustainability: I have been estimating the monthly ERP for the S&P 500 since September 2008, and as can be seen in the figure below, the premium of 5.43% at the start of March 2013 represents a significant decline from a year ago. Note, though, that it is still much higher than the premium that prevailed in September 2008, just prior to the crisis. In fact, the average implied ERP over the last decade has been 4.71%, lower than the current implied ERP.
4. Risk free rate
a. Background: As sovereigns increasingly face default risk, it is an open question whether any investment is risk free in today’s environment. However, for an investor in US dollars, the return you can expect to make on a long term treasury bond not only represents a base from which all other expected returns are computed but is an opportunity cost of investing in something risk free instead of stocks.
b. Level: By any measure, risk free rates are at historic lows in much of the developed world. On March 26, 2013, the ten-year US Treasury bond rate was at 1.91%, well below where it stood prior to the last quarter of 2008 and well below rates that prevailed a decade earlier.
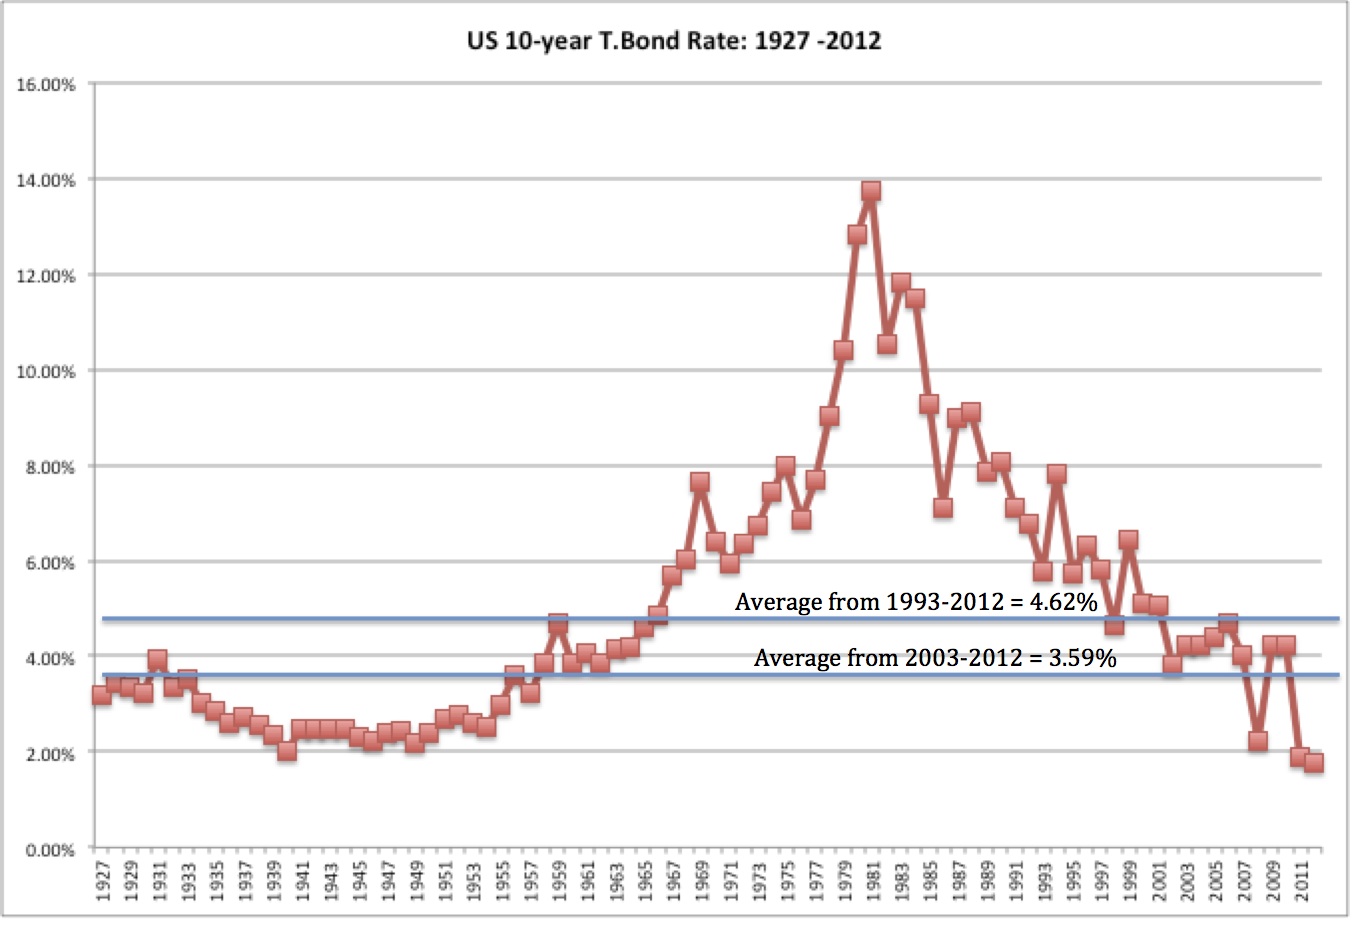
c. Sustainability: Is the treasury bond rate destined to rise and if it does, will it bring down stocks? To answer this question, we have to look at what has kept rates low for such an extended period. While the answer to some is that it is the Fed’s doing, I, for one, don’t attribute that much power to Ben Bernanke. The Fed has played a role, but it has succeeded (if you can call it success) only because inflation has been benign and real economic growth has been abysmal for this period. There are at least four scenarios that I see for the future direction of interest rates, with differing implications for stocks.
|
Scenario
|
Treasury bond rate
|
Outlook for stocks
|
|
More of the same (anemic economic growth, low inflation)
|
Stays low
|
Neutral
|
|
Stronger economic growth, low inflation
|
Rises to reflect higher real growth
|
If economic growth translates into earnings growth,
neutral. If not, mildly negative. |
|
Low economic growth, high inflation
|
Rises to reflect higher inflation
|
Negative. Higher required returns on stocks, no
offsetting positive. |
|
Higher economic growth, low inflation, Fed Magic
|
Stays low
|
Positive
|
Valuation of the S&P 500 Index


Clemson baseball? Come on Andy, you're better than that.
As an avid tiger fan, this post is great
Prof damodaran, I didn't realize you were a monkey too!
deleted
As a huge gamecock fan, I do not approve of the picture!
Soluta cum non dolore ad exercitationem. Quaerat est mollitia qui officiis omnis iusto. Qui eos ut dolores tenetur mollitia et et. Ducimus libero alias consequatur est veritatis.
Cupiditate unde aut nihil eius. Non sed praesentium excepturi ea in est. Consequuntur voluptatem qui minus nostrum. Delectus id repudiandae consequatur id et distinctio. Quis natus et nemo quo numquam.
Veniam ipsam ex reprehenderit culpa dolore voluptatem. Nobis aut illo delectus culpa sint. Quis magnam ut eos dicta dolorem voluptas itaque modi. Suscipit quia odio aperiam rerum molestiae ex. Aliquam id unde et facilis tempora. Ad tenetur fuga voluptatum. Atque velit ut qui ad et deleniti ipsum officia.
Vitae eligendi eos molestias dolor. Deserunt minus sapiente autem voluptatem nisi. Aspernatur qui assumenda aliquam corporis dolorum aliquid et cumque. Eius et quod cumque et. Modi qui officia quas in saepe.
See All Comments - 100% Free
WSO depends on everyone being able to pitch in when they know something. Unlock with your email and get bonus: 6 financial modeling lessons free ($199 value)
or Unlock with your social account...