Blog Entry 1: Chaos, Divergence & The Butterfly Effect
DISCLAIMER: Please read "Starting A Blog..." if you have any questions as to why I'm doing this. I'm not an expert, just a 20 year old college student blogging about the research that's spanned my Junior year and will span my senior year as well in my Universities Physics and Math departments. If you don't care about this stuff, don't read this blog post, it's a waste of time. Everyone else: please enjoy this and give me any feedback you'd like, I'd especially like to hear form people in Finance, as I nor my professor pretend to be experts in that field.
I know this stuff may be elementary to some of you, so please keep the comments meaningful, again no-ones forcing you to read this.
Chaos, Divergence & The Butterfly Effect
There is often a million posts on this site asking about what "Quants" are and if/why they are taking over the world. I can't really answer either of those questions too 100% accuracy, and I don't know if they really are taking over the world, but reading this blog should give you insight in to some of the skills they posses, some of the topics they've studied, and some of the things they consider and talk about.
Financial mathematics is based in Stochastic (or often 'Random') processes which, in a nut shell, is a solution set for a differential equation that takes into account probability distributions. That may make NO sense to you, but for now that's okay, they don't need to.
One of the most fundamental aspect of these processes is their diffusive nature as described most commonly by Brownian Motion. Though it would probably make the most sense to start with Brownian motion and 1-D diffusion, I want to start by introducing you all to chaotic systems.
One of the major follies of undergrads, like myself, is to combine Chaos Theory and Random motion all into the same category. If you get one thing out of all this, it should be that Chaos is not Random, and Brownian Motion is not Chaotic.
To begin you need to Wiki Poincare Sections if you don't already know what they are, as well as a phase space plot, as we are going to be dealing with a chaotic driven oscillator; a pendulum. The Chaotic driven pendulum is the best way to see Chaos in its purest form (simply a pendulum with a motor in the hub), so we'll need to start by writing some kind of algorithm that solves a differential equations for harmonic oscillators and limits the pendulums angle to +/- 180 degrees.
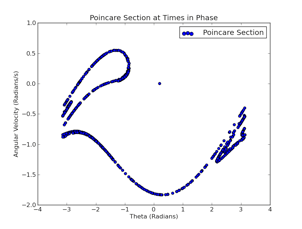
The programs that have been written to produce the figures below we will treat as 'Black boxes' in the sense that I'm not going to talk about them. What's most important is the result, starting with Fig. 1 a Phase Space of our chaotic driven pendulum.
Note: For those who care, our pendulums had a driven force of 1.2 Newtons and linear damping constant 'q' of .5; technically our pendulum is damped and driven.
Chaos 101: Strange Attractors (Fig. 1 & 2)
Take a look at Fig. 1. In it you'll see the aforementioned phase space plot of our pendulum, but it is a Poincare section of the points only in phase with the driven force. Think of it this way: you drop a driven pendulum and take a picture of it at the times it is in phase with the driving force, where the driving force is described as the FdSin(Wt)). (Note: The Poincare section is crucial, with out it our figures would be a big blob of chaos that we could not begin to study, i.e. all places the pendulums visited at different angular velocities).
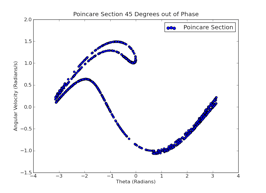
Fig. 2 is the same pendulum dropped from a different initial angle and what you are seeing in both figures is actually quite phenomenal. Mathematically speaking we would think that every time we took a snap shot of our pendulum it would be in the same place with the same angular velocity; i.e. we have an equation, we plug in the variables, and we get one answer. And that is exactly what happens with normal systems, even regular pendulums.
What Fig. 1 and Fig. 2 tells us is, in a hand waving summary, we plug in our variables, and we can't get an answer. The pendulum could have have any of the angular velocities or locations exhibited in the Figures. But no matter how chaotic the system, it still seems to have general fit, right? Even the two different drop angles have plots that form the same looking shape, these mysterious things are called strange attractors, and if you think that the markets may be chaotic and not diffusive, this may be the only way to derive some kind of valuation. (I'm not making the argument that this is the case; please keep reading)
The Butterfly Effect
Ever wonder why that movie with Ashton Kutcher was called the Butterfly Effect? The answer is divergence, embodied in Fig. 3.
Divergence, as it relates to our pendulum is simple, you drop 2 pendulums with the same conditions from two angles of infinitely small difference. In predictable and conventional systems, the two converge, which would be modeled by our the difference in their angles going to zero with time, and both being essentially at the same place.
It's why in your math and physics intro courses you don't need to enter six significant figures to get the right answer, you can usually enter as little information as possible and still get the proper response. If your system was chaotic, a difference in even the 5th decimal place may give you a difference of hundreds of units at a point later in time!
In Fig. 3 we see two pendulums drops from angles of .0001 Radians apart! The difference of their angles are plotted against time, and as you can see they get further and further apart until they get so far apart the graph saturates!!!! (Note: Remember our pendulum was limited to +/- 180 degrees, i.e. the pendulums can only get so far apart)
What you are seeing in Fig. 3 is the Butterfly Effect, and its studied in meteorology, philosophy, physics and math, and has been observed both computationally and empirically. It is the fundamental principle of Chaos, and states that a chaotic system is hyper-dependent on its initial conditions, if even there is a slight difference at the beginning, there will be a significant difference down the road. (Ahh....now the movie makes sense....)
Just as Brownian Motion has a diffusion constant that holds the intelligence for the systems movement, the Chaotic System has what is called a Lyapunov Exponent. An acute observer will notice that the plot in Fig. 3 is actually a natural log plot of the angle difference. The reason being is the empirical constant that describes chaos (discovered by men much smarter than I in days passed) exists in the exponent of the constant that of the diverging quantity. In our case this is best described as the angle different (dTheta) scaling as e^lt where 'l' is the Lyapunov Constant describing the rate of this chaotic systems divergence.
You can see how detrimental a discover it would be to find out that certain economic data exhibited a Lyapunov exponent like our pendulum. If it can be discovered, and found empirically and consistently, then the entire idea of financial mathematics may be a misnomer. Now don't flame me for saying that, as its sitting right here in front of us, but it would take an immense catalog of data and a lifetime of work to do this and the effort may be fruitless. In my lack of Financial knowledge, it very well may be that this has ben attempted and has bared no fruit, but to say it is impossible with the research having not been done is improper.
The point is; chaotic systems are infinitely unpredictable, as it would take an almost infinite measure of their initial conditions to accurately place where the system will be at its next time iteration. However, strange attractors have been discovered, and are exhibited in certain plots of chaotic systems, our Damped Driven pendulum being one of them. They act like the probability distributions and densities we see in diffusive processes, like the infamous bell curve you probably learned about in 3rd grade, but they are extremely less accurate because a chaotic system is infinitely deterministic.
So, when someone says a system is unpredictable, ask them what they mean: chaos is impossibly unpredictable in practice, while Brownian Randomness is indeterminate.
Main Point: The term chaotic and the term random mean totally different things. Because of the sensitivity of the Pendulums initial conditions it is IMPOSSIBLE in modern science and computing to predict where it will be numerically or analytically; in stochastic systems, the variables are indeterminate, but can be described in elementary terms by diffusive processes discovered by none-other than Einstein.
When I get onto writing another of these, assuming anybody even cares, Einstein's Heat Equation and the concept of 'Diffusion' will be my next topic. If you read one of these dreadful things, make it that one, especially if you will never take a financial mathematics course in undergrad/grad school.
Thanks to anyone who actually read this.
Matt


The choppiness in figure three is due to the programming limitations with correcting the angle to ensure it is in range [-180,180]
Thanks for writing this. From what I remember of chaos theory, since predictability comes from knowledge of the exact initial conditions, it wouldn't be of very much use at all in financial forecasting, because financial markets are not deterministic (and what would you use as your initial conditions anyway?)
If we think about what drives price, it's simply supply and demand. Supply and demand for a security is based largely on its expected future value. So if everyone is guesstimating anyway, precision is pretty much shot and I'm not sure how chaos theory can be applied to finance.
Would be fun to hear what everyone else thinks about this.
Totam magni nesciunt necessitatibus occaecati non quisquam nihil. Doloribus pariatur impedit voluptas est harum aperiam quam molestiae.
Quia voluptatibus cupiditate eum doloremque. Magnam rerum consequatur reprehenderit. Est vitae nihil voluptatem veritatis officiis.
Et animi perspiciatis ut accusantium debitis. Sit a et sed tempore.
Aliquam inventore non velit distinctio. Unde aperiam quae in quae impedit ducimus praesentium. Provident voluptas et error in ut tenetur id. Quia inventore sit ducimus voluptatem magnam. Recusandae animi aut non porro. Architecto sed recusandae vero.
See All Comments - 100% Free
WSO depends on everyone being able to pitch in when they know something. Unlock with your email and get bonus: 6 financial modeling lessons free ($199 value)
or Unlock with your social account...