Dallas Trimmed Mean
A measure of core inflation in the price index for Personal Consumption Expenditures.


What is the Dallas Trimmed Mean?
The Dallas Trimmed Mean is a measure of core inflation in the price index for Personal Consumption Expenditures(PCE). It is popularly known as the trimmed mean PCE inflation rate and was introduced only recently in 2005.
Since it is calculated by the staff at the Dallas Fed using data from the Bureau of Economic Analysis (BEA), it is called Dallas trimmed mean.
The average inflation rate after "trimming" away a certain portion of the distribution of price changes at both ends of that distribution is known as the trimmed-mean rate of inflation.
The Federal Reserve Board has used the PCE to express its inflation outlook in its semi-annual monetary policy reports to Congress since February 2000.
Before then, the Consumer Price Index (CPI) was used to describe the inflation outlook. Trimmed means have been applied to the CPI (and comparable price indices in other countries, such as the UK's Retail Price Index).
According to a report by the Federal Reserve Bank of Dallas, other trimmed-mean inflation measures (including the trimmed-mean CPI from the Cleveland Fed) are constructed differently from the trimmed-mean PCE inflation rate from the Dallas Fed.
The trimming ratios for the trimmed-mean PCE are notable for being asymmetrical; beginning in 2009, its calculation excluded 24 percent of the mass (using expenditure-share weights) from the lower tail and 31 percent from the upper tail.
Key Takeaways
- The Dallas Trimmed Mean is a measure of core inflation in the price index for Personal Consumption Expenditures (PCE).
- Popularly known as the trimmed mean PCE inflation rate.
- It is calculated by the staff at the Dallas Fed, using data from the Bureau of Economic Analysis.
- The Trimmed Mean PCE Inflation Rate for a given month is calculated by observing the price changes for each component. The various price adjustments are then ranked from the most significant decrease to the most significant increase.
- The weighted average of the final, trimmed observation list is then used to compute the inflation rate.
- In each month, items whose prices rose by more than the upper trim points are excluded, and the items whose prices fell by more are also excluded.
- The PCE price index is based on a Fisher-Ideal index, whereas the CPI is based on a Laspeyres index.
- The weights used in the PCE price index are based on business surveys, and the weights used in the CPI are based on a household survey.
- Trimmed-mean inflation can forecast headline inflation, infer slack, and provide an explanation for Federal Reserve policy decisions.
What is Core inflation?
Price fluctuations for the aggregate basket of products and services fluctuate significantly from quarter to quarter and from year to year. This has an impact on consumer welfare and overall consumer prices.
Faced with this volatility, many economists and decision-makers have looked for a solution that will lessen the overall inflation's temporary volatility while preserving its fundamental characteristics.
A single measure of inflation may be preferred to multiple measurements. Eckstein (1981) is credited with coining the term "core inflation," which he defined as:
'The trend increase of the cost of production factors 'originates in the long-term expectations of inflation in the minds of households and businesses, in the contractual arrangements which sustain the wage-price momentum, and in the tax system.'
The long-term pricing trend is represented by core inflation. Therefore, temporary price adjustments should not be included in calculations of long-term inflation. One might achieve this by omitting commodities with often fluctuating costs, such as food and energy.
However, many economists strongly disagree with the practice of removing food and energy from core inflation because they are significant "core" costs for the majority of people.
Evolution
An exclusion-based core inflation measure is the earliest measure used. It is in the form of 'inflation excluding items X, Y, Z'. It is similar to the U.S. Consumer Price Index (CPI), excluding food and energy, or PCE, excluding food and energy.
In the 1990s, core inflation measures based on reliable estimators of central tendency medians and trimmed means—began to acquire more traction. This family includes the Federal Reserve Bank of Dallas's trimmed-mean PCE inflation rate.
Core inflation includes three elements:
- Consumer Price Index (CPI)
- Personal Consumption Expenditures Index (PCE)
- The Outliers method
As per a paper by the federal reserve bank of Dallas, "Core" inflation metrics frequently take center stage in the frameworks that policymakers employ for forecasting as well as in their narrative interpretations of actual inflation outcomes.
The US Bureau of Labor Statistics stated the overall consumer price index had been known to be subject to fluctuations brought on by significant changes in a small number of goods at least since the 1970s.
Significant short-term volatility in the inflation index is caused by price changes in a small number of products.
The general justification for keeping an eye on a core inflation measure is that headline inflation (inflation including food and energy prices) might experience large transitory shocks unrelated to changes in cyclical inflation pressures or public trust in the central bank's commitment to long-term price stability.
Both predicting inflation and formulating policy could become more challenging as a result of this transitory variation.
Calculation of the Trimmed Mean PCE Inflation Rate
The Trimmed Mean PCE Inflation Rate for a given month is calculated by observing the price changes for each component. The various price adjustments are then ranked from the most significant decrease to the most significant increase.
The most severe observations are "trimmed" or removed from this organized price list. The weighted average of the final, trimmed observation list is then used to compute the inflation rate.
The 'trim points' have the following interpretation. In each month, items whose prices rose by more than the upper trim points are excluded, and the items whose prices fell by more are also excluded.
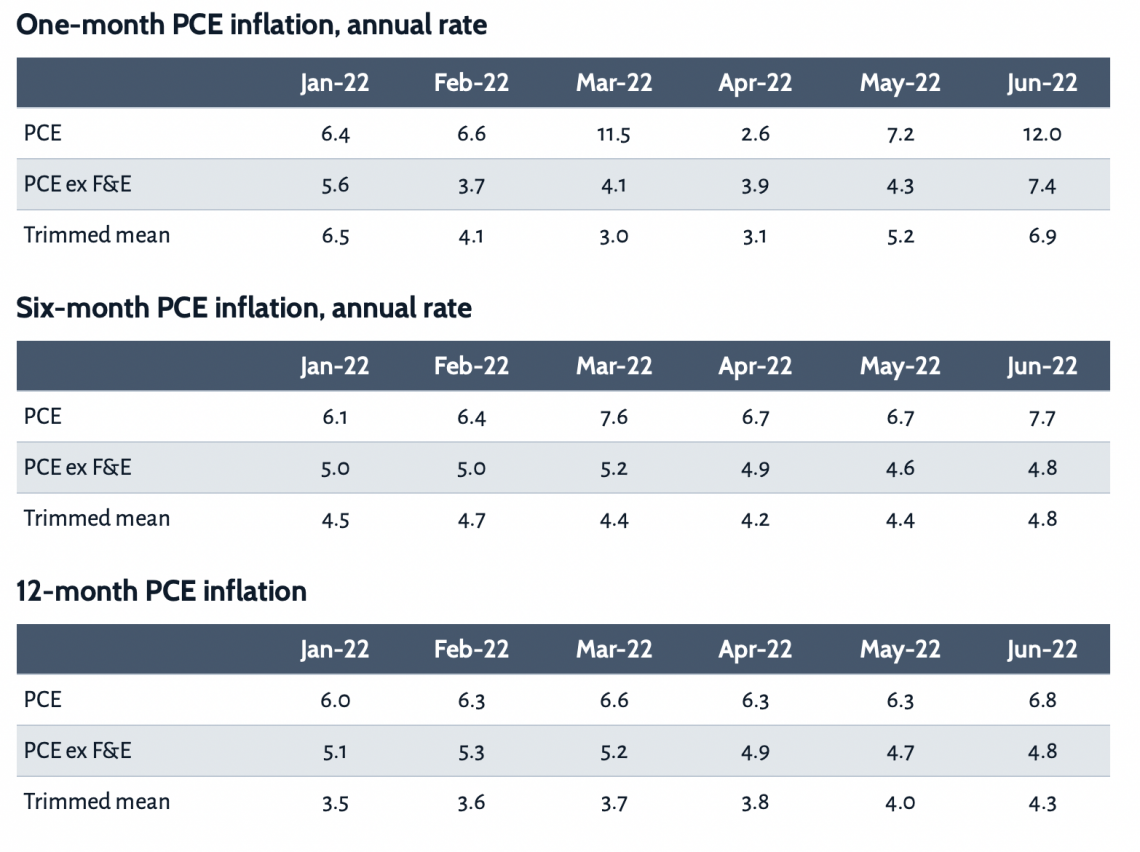
As per a report by the Federal Reserve of Dallas, for the past year ending in June, the Trimmed Mean PCE inflation rate was 4.3 percent.

The Bureau of Economic Analysis (BEA) reports that the inflation rate for PCE overall was 6.8% over 12 months and that for PCE excluding food and energy was 4.8% during the same period.
Inflation rates for PCE overall, PCE excluding food and energy, and Trimmed Mean PCE inflation are all shown in the tables below. In addition, inflation rates for one month, six months, and a year are provided in the tables.
You can visit this document to dive further into what components are included and excluded from the list.
Consumer Price Index Vs. Personal Consumption Expenditures
There are two main ways to calculate the prices that Americans pay for products and services.
One is the Personal Consumption Expenditures (PCE) price index, created by the Bureau of Economic Analysis, and the other is the Consumer Price Index (CPI), generated by the Bureau of Labor Statistics (BLS/BEA).
The two indices are designed differently and tend to behave differently over time since their underlying concepts differ.
The CPI increased by 2.6 percent annually in the fourth quarter of 2010, whereas the PCE price index only increased by 1.7 percent annually, a 0.9 percentage point differential.
The PCE price index is based on a Fisher-Ideal index, whereas the CPI is based on a Laspeyres index. Superlative indices are challenging to apply in real time because they need data on expenditures for the present period, which is not accessible.
While the weights used in the PCE price index are based on business surveys, the weights used in the CPI are based on a household survey.
Because of this conceptual distinction, several items and costs in the PCE index fall outside the CPI's purview.
For a thorough understanding of the variations between the CPI and the PCE index, a range of lingering discrepancies, including seasonal-adjustment differences, pricing differences, and residual differences, must be taken into account.
For instance, the PCE index for airline rates is based on income from passengers and the distance that passengers fly. However, the CPI is based on the costs of flying on a sample of routes.
Advantages of Using the Dallas Trimmed Mean
The following are the advantages of trimmed mean PCE inflation over other methods of calculating core inflation:
-
Compared to headline PCE inflation or ex-food-and-energy PCE inflation, trimmed-mean PCE inflation is more strongly and consistently associated with labor-market slack. It is, therefore, more predictable than any of these alternative inflation metrics.
-
First-release trimmed-mean inflation rates are consistent with the latest-vintage mean and median headline inflation rates derived over the same samples and averaged over pieces that cover the business cycle.
-
Because it is a less biased real-time estimate of headline inflation and because it more effectively removes transitory variance, leaving just cyclical and trend components, trimmed-mean inflation is the better communication and policy tool.
-
For standard exclusion sets, such as food and energy items, it is frequently the case that there are items outside the exclusion set that display price changes that are at least as volatile as those of the excluded items. Food and energy products aren't always the most volatile commodities, and neither are the most volatile commodities always just food and energy.
-
Compared to headline PCE inflation and ex-food-and-energy PCE inflation, trimmed-mean PCE inflation is more strongly and consistently related to labor-market slack and is also more predictable.
-
As predictions of headline inflation, real-time trimmed-mean inflation projections outperform models that aim to predict headline inflation directly.
-
The short-term fluctuation obscures the link between headline inflation and labor-market slack in headline inflation, which is filtered out by trimmed-mean inflation.
Trimmed-mean inflation can forecast headline inflation, infer slack, and provide an explanation for Federal Reserve policy decisions because of these characteristics.


or Want to Sign up with your social account?