Forward P/E Ratio
One of the variations of PE ratios that use the company's future EPS instead of historical EPS to forecast the amount of dollars investors are willing to pay today for a dollar of the company's future earnings.


What Is Forward Price-to-Earnings (Forward P/E)?
The forward PE ratio is one of the variations of PE ratios that use the company's future EPS instead of historical EPS to forecast the amount of dollars investors are willing to pay today for a dollar of the company's future earnings.
The forward PE ratio is calculated by dividing the current market price of the shares by the projected EPS of the organization.
Mathematical the projected PE ratio can be depicted as:
Forward PE Ratio = Current Shares Price / Estimated Future Earnings Per Share
A forward PE ratio is more relevant than the historical PE ratio, given the investors would like to know about the estimated future standing of the organization's earnings.
Here, the future earnings are based on estimations and assumptions of certain specific factors.
One of the primary challenges of the forward PE ratio is the estimation of an organization's projected EPS. This can be found in the analysts' consensus or other sources.
Let's start by understanding the P/E ratio before we jump on to Forward P/E to have proper background information.
Key Takeaways
- The Forward Price-to-Earnings (Forward P/E) ratio is a variation of the Price-to-Earnings (P/E) ratio, using a company's projected earnings per share (EPS) instead of historical EPS.
- Forward PE is more relevant than the historical P/E ratio, as it provides insights into the future standing of the organization's earnings. The challenge lies in estimating the organization's projected EPS, often derived from analysts' consensus or other sources.
- The P/E ratio is derived by dividing the Current Market Price by the Earnings per Share. A high P/E may indicate a company striving for increased earnings or being overvalued.
- Negative EPS results in a negative P/E ratio, rendering it meaningless. Investors typically interpret Forward P/E alongside other ratios and models for a comprehensive understanding.
How do we calculate the P/E Ratio?
The P/E ratio is the share price of a stock divided by the Earnings-per-Share. This helps in determining whether a stock is over or undervalued.
Earnings Per Share (EPS) is calculated by dividing the net income by the number of shares outstanding. This metric is used by organizations to understand the amount of net income distributable to its outstanding shares of its common stock.
The PE ratio gives the investors a measuring yardstick to understand the current share price relative to its earnings per share.
The PE ratio is generally popular among analysts and investors because the PE ratio provides a better insight into a company's value.
How do we know what P/E multiple is under/overvalued?
- Comparing the P/E Ratio with the industry P/E Ratio: We can compare the stock’s P/E to the industry P/E to get a strong viewpoint of where the company stands in the industry in valuation terms.
- Tracking the past trend: Tracking the past trend of the P/E over, say, 3 or 5 years can give us a good idea of the value of a company.
- Using a rule of thumb: We can also follow the principle given by the great Benjamin Graham, who, in his book, mentioned that "a P/E Ratio of 30x is overvalued, and anything under 15x is undervalued."
Components of P/E
The P/E Ratio of a stock determines its relative valuation, which is greatly influenced by the business cycles.
The price-to-earnings ratio will be derived when the Current Market Price is divided by the Earnings per Share.
If a company has a high P/E, it is on a quest to increase its earnings and strive for it or is probably overvalued.
The current market price of a stock is the price per share, and the EPS is the business's net income per share.
We can easily get the stock's current price by logging into a website providing financial data, such as Yahoo Finance, MarketWatch, Investing.com, etc.
So, arithmetically it’s like

P/E Ratio = Current Market Price/ Earnings per Share
So, to calculate the ratio, it is important to gather the Current Price and the Earnings-per-Share of the share.

EPS = Net Profit/ Total Number Of Shares Outstanding
The net income and outstanding shares can be obtained from the company's income statement and balance sheet, respectively.
The unit for the ratio is “x,” which means “times.” As explained, it is the x times of money the investor puts into the business.
It is important to note that the ratio is calculated per share and not the entire value of the business, i.e., market capitalization.
Note
P/E is a valuation measure that tells how often the money is being paid relative to the profit.
Interpretation Of Forward P/E
As we understand how the normal P/E works, we’ll get on to the discussion wherein we predict the Earnings-per-Share for the business, influenced by various internal and external factors (discussed further).
Forward P/E is entirely dependent upon estimations and assumptions. It includes all the unforeseeable happenings of the future.
Hence these assumptions may or may not entirely give an accurate future price-to-earnings.
To explain it simply, it is nothing but the Current Market Price divided by the future Earnings per Share.
In arithmetic terms,
Forward P/E Ratio = Current Market Price / Estimated Earnings per Share
The Forecasted EPS is dependent upon the analyst’s expectations, broker’s recommendations, etc.
Estimated Price-to-Earnings is contingent upon futuristic assumptions rather than counting on historical figures.

The estimated EPS figures are taken for the coming quarters or the next 1 or 2 years.
So, in the end, by calculating this ratio, an investor can decide to invest in the under/overvalued stock in the current situation. Also, he can oversee the profits he can make shortly.
It must be noted that the estimated Earnings-per-Share can also go wrong in case of any economic downturns or bad news for the company, which fundamentally impacts its growth prospects.
Note
Forward P/E is like P/E, but it is an estimated stock valuation, where Earnings-per-Share is predicted for the coming quarters or the next 1 or 2 years. Then, the price is relatively compared to the estimated Earnings-per-Share.
Factors for Estimates of EPS
The assumptions and estimates made by various renowned institutions and investors are usually followed for forecasting the future Earnings per Share for the forward P/E multiple.
The estimates are drawn after considering many internal, external, micro, and macroeconomic occurrences and expectations.
Internal Factors
The internal factors influencing the estimates of the EPS are as follows:
- Management of the company
- Decisions of the Board of Directors
- Suppliers of the company
- Creditors
- Distributors
- Employees, etc.
External Factors
The external factors influencing the EPS include the following components:
- Government measures
- Monetary policies
- Decisions of regulatory authorities
- International and geopolitical impacts
- Political and socio-economic factors
- Economic downturns, and
- Increases in the price of raw materials.
All these factors must be carefully considered while making forecasts for the net income in the coming years.
As the concept of business cycles depicts, anything that goes up comes down, i.e., an economy goes into a boom period and then witnesses economic downturns.
With that, it goes into recession and then depression, then it gets backed up again when demand kicks in, then again into boom and repeat.
Note
The earnings of a business over the past period are also considered, which helps gather proper relatable information to predict future earnings.
Fluctuations And Trends
When all the above factors come together and interact, it impacts each company's and industry's functioning.
Then what happens next?
On a serious note, it becomes history, and the functioning of the business is projected in the growth/decline of the stock price, revenues, expenses, profits, etc.
When these historical events are combined, they become a source for estimating future events or merely a calculated prediction.
Very importantly, the market sentiment is optimistic (bullish), futuristic, and fluctuating. Hence, these estimates are of vital importance.
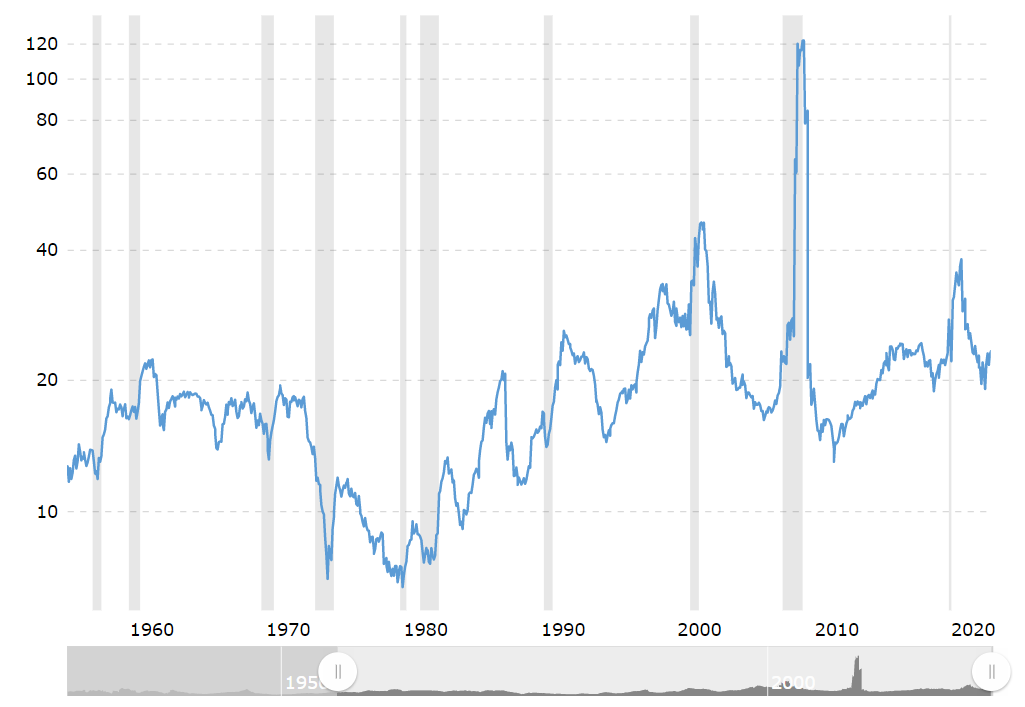
During nearly six decades, the S&P 500 index's P/E ratio has seen numerous ups and downs, whether it's the 1973 oil crisis, the 1991 Gulf War, the dot-com bubble crash of 2002, or the 2008 financial crisis.
You may recall many of these occurrences since they influenced you somehow.
The P/E Ratio reaches a peak, the bubble bursts and the entire market collapses.
The graph below depicts these significant events perfectly. The market continues on and on and will increase in the future; that is the core idea.
Forward PE Ratio Example
Now, we’ll try to put everything we have learned up till now into real and practical implementation. For this, we will figure out EPS(trailing, estimated), Future P/E, Current(Trailing) P/E, and at the end, PEG (so that no confusion is left in our curious minds).
To begin with, we’ll start with a simple price-to-earnings ratio.
We generally use trailing 12 months Earnings-per-Share, available on many websites, or we can figure out the EPS ourselves, i.e.,
EPS = Net Income / Total number of shares outstanding
We are taking Alphabet Inc. (Google) as our example:
EPS for Google is $4.53. This means that for every share, Google is earning a profit of $4.53.
The current price of one Stock of Google is $95.00 as of 02/13/2023.
P/E (TTM or Current)
To get the P/E (trailing 12 months or current) Ratio, we need to divide the Current price by the EPS(TTM). Where
P/E Ratio = Current Market Price/ Earnings per Share
Current market price= $95.00
EPS = $4.53
P/E = 20.98x
P/E (Forward)
To calculate this ratio, we need to predict the future earnings of Google by ourselves, by relying on various reputed institutions or following renowned investors, or by combining all these and considering all the factors discussed above to predict the future.
So, to predict EPS here, we are considering the strong business growth of Google and the current tech-layoffs scenario; we may say that EPS for next year will be $5.50.
Note
There may be many more factors influencing the future growth of Google; this is just for educational purposes.
So, EPS (next year estimate) = $5.50
Current Price = $95.00
Forward P/E Ratio = Current Market Price/ Estimated Earnings per Share
Forward P/E = 17.27x
Interpretation Of The Examples
If we look at this way for the next year, the stock of Google is undervalued when relatively compared to the current share price.
This may give good returns in the next year. The stock at this moment is a good buy opportunity on the one hand. On the other hand, if one feels that the current scenario in the tech industry isn’t good enough to invest in the next year or so, it cannot be ruled out.
This is how the estimated price-to-earnings can be interpreted.
Merits and Demerits of Forward P/E Ratio
Heads up, everybody; now we will learn about this ratio's advantages and disadvantages. Why? Because it is important for an investor not to rely on this single ratio to make a profit, as there are many more important valuation-related ratios and models.
Merits
- Helps determine the future value derived by keeping the current share price relative to the forecasted earnings-per-share.
- It helps determine the ability to predict future profits and the up/downtrend for the share.
- It Ascertains whether a stock is undervalued or overvalued in the future and answers whether it is a good buy today.
- As the P/E gives the ability to use it as a price mark for the stock, it also makes it an important valuation measure.
Demerits
- It is highly dependent upon the use of assumptions and estimates of the future. As no one sees the future, no one can predict the market's direction, and in a blink, everything can change.
- The unforeseeable external events of the future, which are not in the control of the business, may turn out to be wrong as a prediction and may jeopardize the P/E estimate concerning the current price.
- Companies, analysts, and expert investors may (or may not) underestimate (or overestimate) their future earnings and hence may or may not be able to beat the street estimate.
- It depends totally on the subjective judgments and experiences of different analysts.

What is the difference between different price-to-earnings ratios?
It is often confusing among people and beginner investors which P/E ratio is correct and which must be used in different contexts.
We will break this down into very simple words which altogether make sense.
P/E Vs. Trailing P/E Vs. Forward P/E
Take it as an elementary English rule of tenses where the present, past, and future tenses are used as a basic rule to determine what to say/write using time as a reference.
- P/E is the present relative valuation measure for the current price and earnings.
- Trailing P/E is a measure for valuing the current price to the earnings of the trailing 12 months.
- Forward P/E is the valuation measure based on future earnings-per-share estimates and the current market price.
Note
It must be noted that P/E Ratio is used interchangeably for Trailing P/E.
Every P/E uses the current share price to calculate the ratio, though the EPS differs with the change in the type of P/E.
Forward P/E Vs. PEG Ratio
Forward P/E is often confused with the PEG Ratio.
PEG Ratio is also a valuation method wherein the current share price is kept relative to the forecasted earnings per share growth rate (%). In contrast, forward P/E uses EPS growth in actual currency terms, not growth terms.
The primary difference between the forward PE and PEG ratio is the difference between the type of growth rate used in the calculations.
Impact of negative earnings and ideology of forecasted P/E
A question may also be raised in our curious minds: how do we interpret the negative EPS, which gives out a negative P/E?
To answer this, let's take an example of a company making a loss in the trailing 12-month period:
The share price of DraftKings Inc. (DKNG) on 02/13/2023 = $15.99
EPS = $-4.05 per share
P/E Ratio = Current Market Price/ Earnings per Share
= 15.99/ (-4.05)
P/E Ratio = -3.95x
As the ratio is coming out in negative terms, then it is considered meaningless.
Note
The negative EPS impacts the entire ratio, irrespective of whether the ratio is based on current, past, or estimation of the future.
As Earth takes a year to complete a sun revolution, similarly, companies disclose their earnings in an ongoing business cycle.
It was found that the approach of buying low price-to-earnings ratio stocks is considered a superior indicator when used with other relative valuation measures, which pan out terrific returns over the long run.
Stocks were categorized based on “value” or “glamor” stocks. The former is a true picture, and fewer investors are putting in their money. The latter has a rosy picture where more investors are putting in money.
“Glamour stocks grow in the coming years and then give minimal returns where the inverse happens in value stocks where they give minimal returns in the beginning and terrific returns in the longer period.”
“P/E did not produce as large an effect as Price-to-book value or price-to-cash flow, possibly because “stocks with temporarily depressed earnings are lumped together with well-performing glamour stocks…….” Lakonishok, Schleifer and Vishny (1994)


or Want to Sign up with your social account?