PEG Ratio
Evaluate a stock's value by considering its P/E ratio relative to its earnings growth rate, indicating potential undervaluation or overvaluation.


What Is the Price/Earnings-to-Growth (PEG) Ratio?
The Price/Earnings-to-Growth (PEG) ratio evaluates a stock's value by considering its P/E ratio relative to its earnings growth rate, indicating potential undervaluation or overvaluation.
Fundamental analysis is the practice of combining all relevant quantitative and qualitative data about a company. It is a fundamental and valuable method for investors who wish to hold their investments for a longer period of time.
When performing fundamental analysis, it is important to consider the Price/Earnings-to-Growth (PEG) ratio. The ratio builds upon the Price/Earnings (P/E) ratio to provide investors with additional insights into a stock's valuation relative to its earnings growth rate.
It is a stock's price-to-earnings (P/E) ratio further divided by the company's growth rate for a specified time.
- PEG ratio combines a stock's P/E ratio with its earnings growth rate, offering a comprehensive valuation perspective.
- Integral to fundamental analysis, the PEG ratio aids investors in assessing a stock's long-term investment potential.
- Ratios below 1 imply undervaluation, while those above 1 suggest overvaluation, with a ratio of 1 indicating fair value.
- Comparing a stock's PEG ratio to industry peers or averages provides valuable context for investment decisions.
- While informative, the PEG ratio should complement rather than replace a thorough fundamental analysis, focusing on factors like free cash flows and qualitative aspects, particularly in evaluating growth companies.
Understanding The Price/Earnings-to-Growth (PEG) Ratio
Unlike the P/E ratio, it also factors in the company's expected earnings growth, providing a comprehensive fundamental view of the company.
Similar to the P/E ratio, a lower PEG ratio may suggest an undervalued stock, while a higher ratio may indicate an overvalued stock. However, the PEG ratio incorporates expected earnings growth, providing a more comprehensive view of the company's valuation.
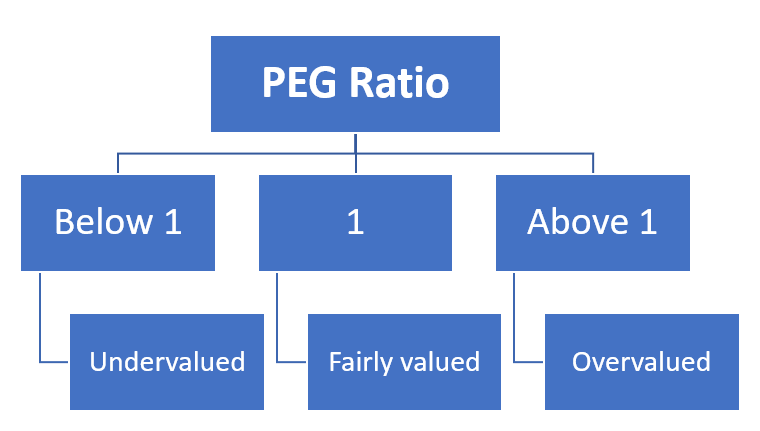
In this case, the benchmark number is 1; anything less than one is considered undervalued, and a number above 1 refers to an overvalued stock.
This ratio's use case is broader than the P/E ratio's, as the P/E ratio only tells us a share's expense based on historical earnings.
A firm might or might not perform in line with its historical earnings, as various internal and external factors associated with earnings can lead to inaccurate current value assumptions.
Therefore, it is imperative to consider a company's future performance.
What is the PEG Ratio Formula?
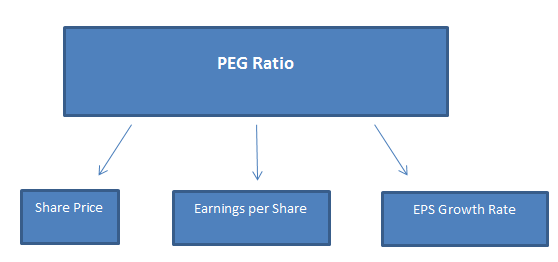
The calculation for this ratio is very similar to that of the P/E ratio. However, in addition to dividing share price by earnings per share, the value is further divided by the growth rate in earnings per share.
It can also be understood as dividing the P/E ratio by the EPS growth rate. The exact formula for calculating the ratio is as follows:
PEG Ratio = [Share Price/ Earnings per Share]/ EPS Growth Rate
PEG Ratio Components
The components of the ratio include the following:
1. Share price
Share price, or stock price, is the amount an investor would have to spend to buy one share in a particular company. The share price is not fixed and can vary depending upon that share's forces of demand and supply.
Higher demand would lead to an increase in a company's share price. Demand can be high for various reasons, such as the company's high performance, dividends paid out by the company, or any other positive announcement made by the management.
Similarly, lower demand would result in a decrease in the company's share prices. But, again, lower demand can have various reasons, such as poor company performance, negative news about management or operations, etc.
Note
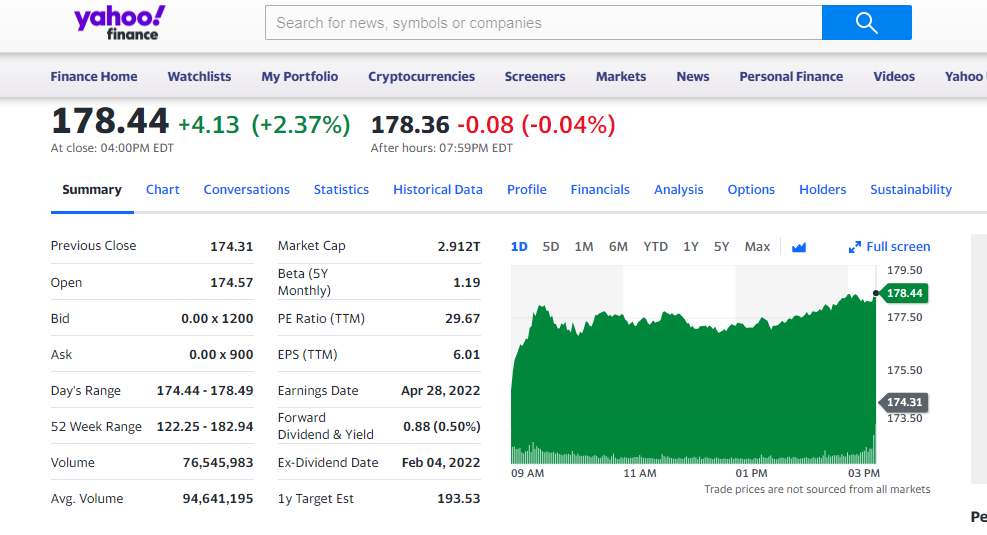
Investors can find a company's share price through various sources or platforms such as - Google, Yahoo Finance, Investing.com, Tradingview, etc. These websites display current, accurate share prices of listed companies in various international markets.
The following is an example of Apple's share price on Yahoo Finance:
2. Earnings per share (EPS)
This is calculated as a company's net profit divided by the outstanding common shares. EPS is an essential indicator of a company's overall profitability.
Earnings per share (EPS) = [Net Income - Preferred Dividends]/ Average Outstanding Shares of the Company
A company's EPS can vary depending on various factors, such as changes in profitability, the number of outstanding shares, or dividend payments. EPS is also sometimes adjusted for certain extraordinary items.
Earnings per share are used to calculate ratios such as the P/E Ratio, the Price/Earnings to Growth Ratio, and others. Therefore, it is imperative to understand a company's EPS in depth.
Investors no longer have to calculate a company's EPS manually; instead, they can find the EPS of a company in two ways:
- Annual report of a company: Companies usually mention all essential and relevant ratios in their annual reports so that their shareholders do not have to search elsewhere for the same
- External websites: If you do not want to scan lengthy annual reports, plenty of websites calculate these ratios for you, such as Yahoo Finance, Marketwatch, Investing.com, etc
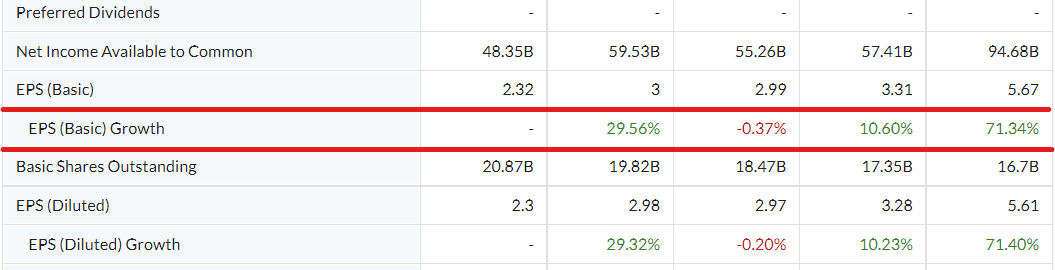
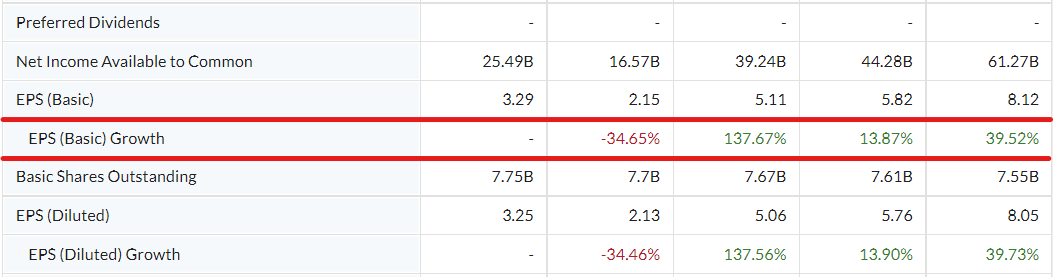
Here is an example of Amazon's EPS found through Yahoo Finance:
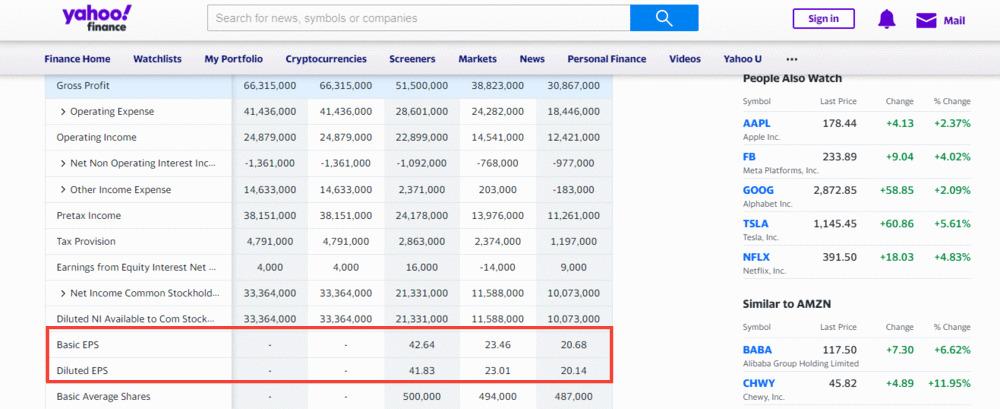
Here, you will find two kinds of EPS.
- Basic EPS: This only factors in a company's issued and outstanding common stock
- Diluted EPS: These factors impact common share price, preferred shares, warrants, stock options, partially convertible debt, etc
3. EPS Growth Rate
The earnings per share growth rate refers to the speed at which a company can grow its profitability (EPS). It is usually calculated as a percentage of the available historical EPS data.
Note
Investors prefer companies with higher EPS growth rates as they represent companies that can grow faster than their competitors. However, it is also essential to understand that higher EPS growth rates are mostly unsustainable over the long term.
To calculate:
EPS Growth Rate = [(EPS1 - EPS2)/ EPS2] * 100
- EPS1: Most recent EPS data
- EPS2: Older EPS data (base)
For instance, if Company X's EPS is growing at 20% CAGR for five years, then in all likelihood, the percentage growth in EPS of X will moderate over the next few years because of the following reasons:
- Entry of competitors: When more businesses enter the same industry, they take away existing competitors' market share and pricing power. Hence, growth rates usually come down for such companies
- Input cost increase (Inflation): Companies that use a lot of inputs have to go through periods of input cost inflation. Wherein the cost of acquiring and purchasing necessary inputs goes up, impacting the company's profitability and margins

How to Interpret the PEG Ratio
It is often found that new investors in the market only consider the P/E ratio to evaluate whether a stock is undervalued or overvalued.
This could be the wrong approach. First, a low P/E ratio does not guarantee that a stock is undervalued, as the company's future earnings growth might be irregular or lesser than expected.
Factoring in the stock's price/earnings to growth ratio may be completely different. A lower ratio often means a stock is undervalued, given its future earnings expectations. On the other hand, a higher ratio means that a stock is currently overvalued, given its future earning potential.
Peter Lynch, a well-known investor who popularizes the PEG ratio, believes that a company's price-to-earnings (P/E) ratio and expected growth should ideally be equal for a stock to be reasonably valued.
According to Lynch, a ratio of 1 represents a fairly valued company, while anything above 1 depicts an overvalued stock. Conversely, an undervalued share should ideally have a PEG ratio below 1.
What is a good PEG ratio?
There is no such absolute number that depicts a perfect ratio. Like most ratios, this must also be seen compared to peer companies or the industry averages.
Let us take an example to explain this point.
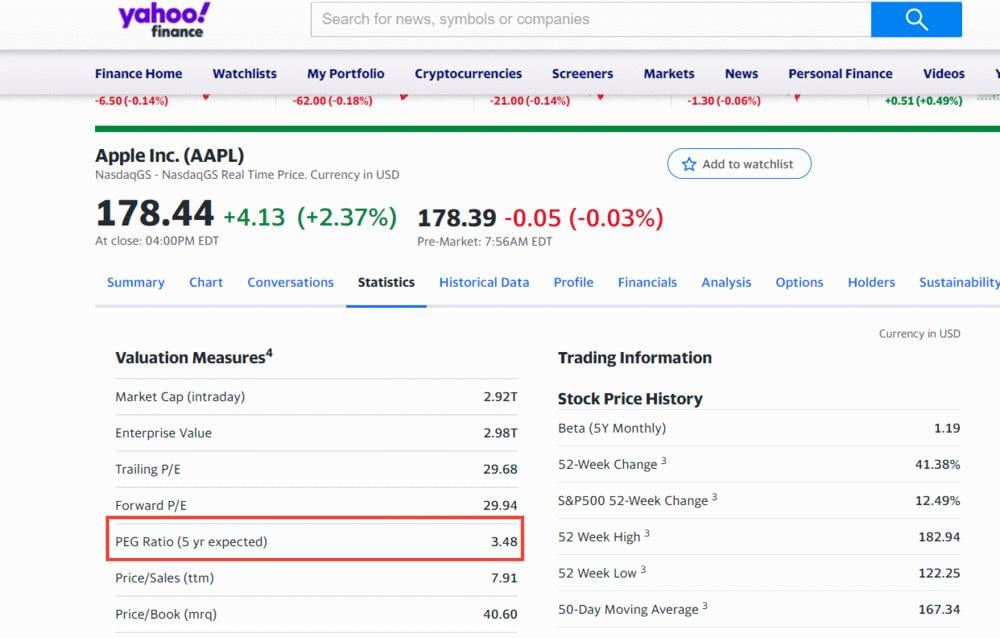
Apple's PEG ratio stands at 3.48, which looks significantly overvalued if taken in isolation. However, let us look at some of Apple's competitors in the same industry.
The following things can be observed:
- All three companies, Apple, Microsoft, and Dell, look significantly overvalued when examined separately
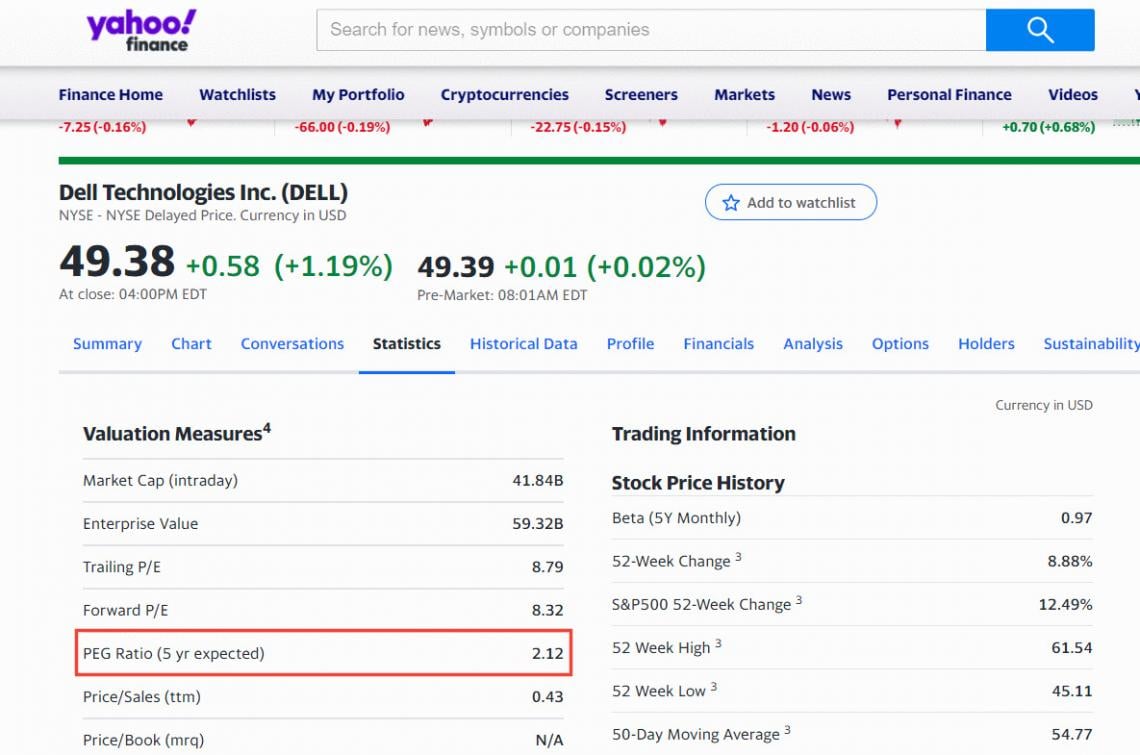
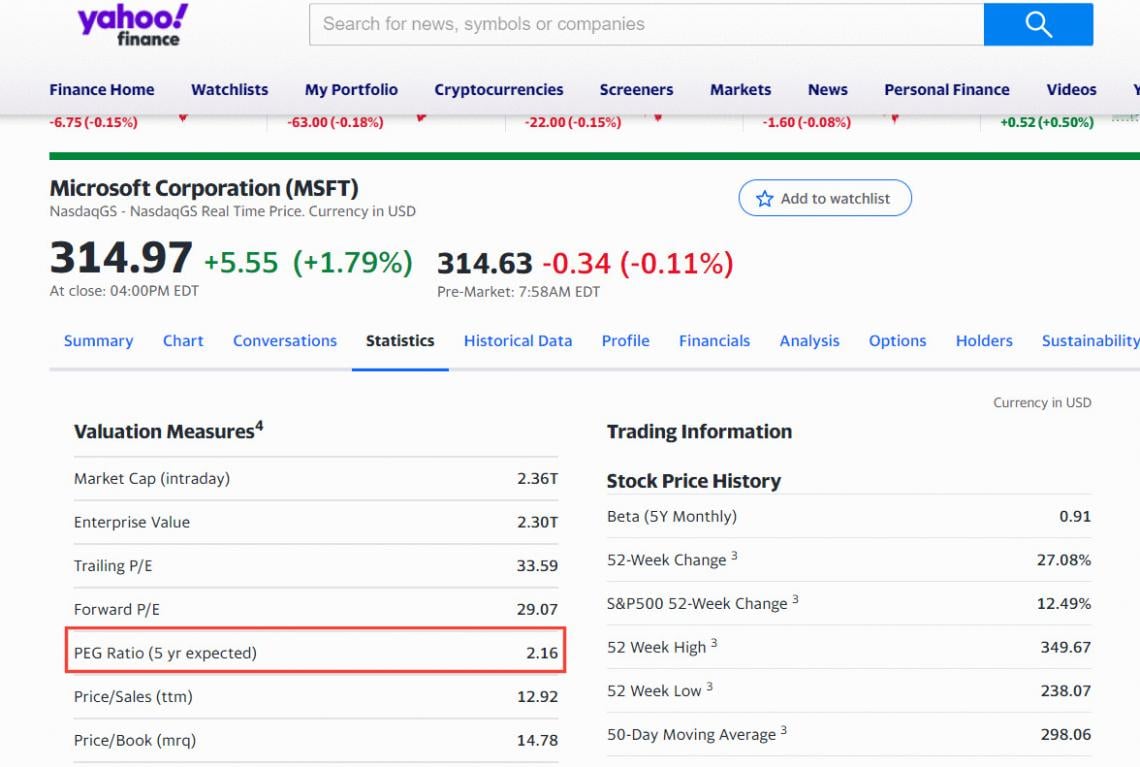
- However, when we compare the three companies, it can be found that in comparison to Apple, Microsoft, and Dell are relatively undervalued, as Apple's price/earnings to growth ratio stands at 3.48, while the other two companies have a PEG ratio of 2.12 and 2.16
- The industry price/earnings to growth ratio for these companies is 2.20. Therefore, by comparing with the industry benchmark, Apple still looks overvalued, while Dell and Microsoft look fairly valued
Note
Another vital factor in deciding whether a stock is trading at a discount or not is to see whether the price/earnings to growth ratio justifies its EPS growth rate.
Example Of The PEG Ratio Calculation
Let us apply this concept to the above example.
After doing some basic calculations, we can compute the following :
For Apple Inc.:
P/E Ratio = 29.68
EPS Growth Rate = 71.34%
PEG Ratio = 3.48
For Microsoft Corp.:
P/E Ratio = 33.6
EPS Growth Rate = 39.52%
PEG Ratio = 2.16
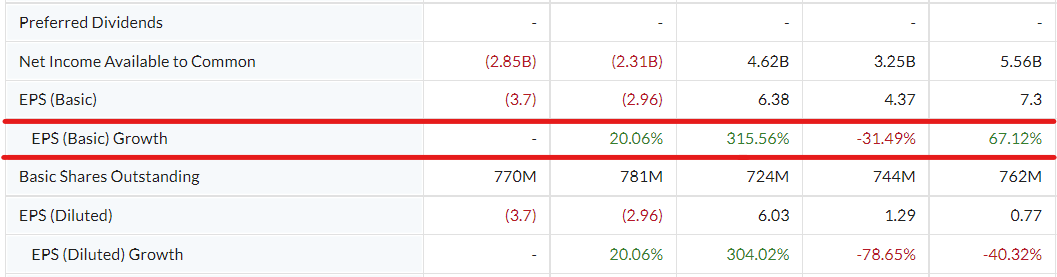
For Dell Technologies:
P/E Ratio = 8.79
EPS Growth Rate = 67.12%
PEG Ratio = 2.12
A rational investor will prefer stocks like Dell Technologies, as despite an EPS growth rate of 67%, it is trading at a P/E ratio of 8.79, and its price/earnings to growth ratio is lower than that of its listed competitors.
Note
It is essential to note that several other fundamental factors related to the business must be considered before making an investment decision, in addition to ratio analysis.
Risks of Using the PEG Ratio
The ratio is a significantly better measure of value than the P/E ratio. We have examined how comparing a company's price/earnings to growth ratio against its competitors can help an investor make better decisions.
This is because, unlike the price-to-earnings ratio, this factor affects future earnings growth potential. However, like any other indicator, there are certain risks and disadvantages of using this ratio:
- It cannot substitute for a complete fundamental analysis of a company, as several other quantitative and qualitative factors are at play, such as the company's management, expansion plans, other financial statements, etc
- It usually considers the future estimates of 2-3 years. This usually will not help investors make investment decisions for long-term investments
- Also, since the ratio considers the EPS growth rate of the company, it may sometimes induce investors to buy a faster-growing company that has performed well over the past 1-2 years. However, there is no guarantee that such companies will perform well over the long term
- Investors must also glance through the free cash flows of a company, as they are significant drivers of valuation and growth. Free cash flows also represent the cash a company can obtain from its profits. This is why financial modeling helps individuals make better investment decisions, and it covers all bases related to the complete fundamental analysis of a company
- Growth companies tend to have higher P/E and PEG ratios than value companies. This is because investors are willing to pay a premium over and above the market price to enjoy a company's future growth


Free Resources
To continue learning and advancing your career, check out these additional helpful WSO resources:


or Want to Sign up with your social account?