Earnings Per Share Formula (EPS)
A financial metric representing the portion of a company's profit allocated to each outstanding share of common stock.


What Is Earnings Per Share (EPS)?
Earnings Per Share (EPS) is a financial metric representing the portion of a company's profit allocated to each outstanding share of common stock. It is calculated by dividing the net income available to common shareholders by the average number of outstanding shares during a specific time period.
It is a key indicator of a company's profitability and is widely used by investors to assess its financial performance and compare it with others in the market. Higher EPS generally indicates greater profitability on a per-share basis.
It can be presented in dollar terms or as a percentage change compared to the previous period. It is considered among the most important metrics for investors as it allows them to evaluate a company's profitability.
Companies with a consistent track record of increasing EPS may be viewed favorably by investors, as it indicates sustained profitability and effective management.
However, relying solely on EPS for investment decisions should be done with other financial metrics and a comprehensive analysis of a company's overall financial health.
- Earnings Per Share (EPS) is a financial metric representing a company's profit allocated to each outstanding share of common stock. It is calculated by dividing the net income available to common shareholders by the average number of outstanding shares during a specific period.
- EPS is a key indicator of a company's profitability and is widely used by investors to assess financial performance and make market comparisons. A higher EPS generally signals greater profitability on a per-share basis.
- Investors utilize EPS to compare companies and evaluate long-term development. A positive EPS is expected as a company matures, while a negative EPS may be acceptable during early development.
Formula and Calculation For EPS
It is calculated from net income by subtracting preferred dividends and then dividing the result by the weighted average shares outstanding.
The formula to calculate is:
Earnings Per Share = Net Income - Preferred Dividends / Weighted Average Shares Outstanding
Example
Let's say a company has $100 million in net income, $5 million in preferred dividends, and 100 million shares outstanding.
The first step in an EPS calculation is subtracting preferred dividends from net income. This would give you $95 million in the numerator of your calculation. Then, divide the $95 million by the 100 million shares outstanding.
The EPS would be calculated as $0.95 per share. Here is an illustration of that calculation:
0.95 = (100,000,000 - 5,000,000) / 100,000,000
If the company had a net income of $50,000, $25,000 in preferred dividends, and 500,000 outstanding shares, the EPS would be calculated as $0.05. This calculation is illustrated here:
0.05 = 50,000 - 25,000 / 500,000
How Is EPS Used?
EPS is a helpful metric for investors because it shows the company's profitability relative to the number of shares in the market. It accurately depicts a company's earnings compared to looking at net income.
Investors may use EPS to compare different companies to see how well they are doing relative to each other. EPS is also used as a financial profitability ratio. Growth in earnings per share assesses a company's long-term development.
A negative EPS indicates that the company is not making money. While negative EPS is alarming, look at the company's bigger picture. In the early development of the company, a negative EPS is expected.
The company is still expanding and setting up operations. But as the business develops, a positive EPS will become expected.
Due to negative EPS, many investors are hesitant to invest in a company with a negative EPS. This is because a negative EPS tells investors a company is not currently profitable.
Where Can You Find a Company's EPS
EPS can be found on a company's quarterly 10-Q or annual 10-K report. It can be found in two places in these reports. First, it will be in the consolidated statement of operations. Next, certain companies will have a section in the account dedicated to EPS.
They will list their earnings and the final EPS figure for clarity. Here is an example of Apple's EPS section in their 2021 10-K report:
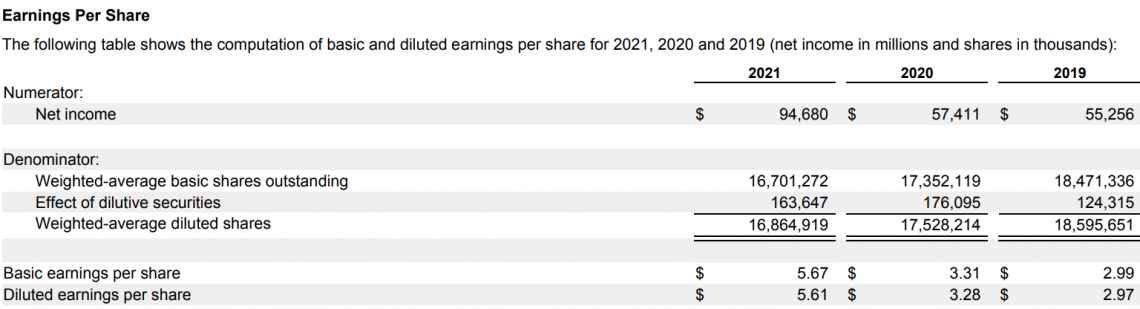
A company's EPS can also be found on finance websites such as Yahoo Finance, but the official and most accurate source is the company's quarterly 10-Q or annual 10-K report.
Basic EPS vs. Diluted EPS
The EPS formula calculates how much profit per share the company has earned during a reporting period. But, it's essential to know that there are two different versions of the EPS, Basic and Diluted.
Let's understand the difference by taking a look at the table below:
| Aspect | Basic EPS | Diluted EPS |
|---|---|---|
| Calculation | Net Income ÷ Weighted Average Shares Outstanding (excluding potential dilutive securities) | Net Income ÷ Weighted Average Shares Outstanding (including potential dilutive securities) |
| Inclusion of Securities | Only considers actual outstanding shares. | Includes potential dilutive securities such as stock options, convertible bonds, and preferred stock that could be converted into common stock. |
| Numerator | Net income attributable to common shareholders. | Net income attributable to common shareholders. |
| Denominator | Weighted average number of outstanding common shares during a specific period. | Adjusted weighted average number of shares to account for potential dilution from convertible securities and stock options. |
| Purpose | Provides a conservative measure of earnings per share. | Reflects a more cautious scenario, considering the impact of potential dilution on EPS. |
| Reporting | Always reported, as it represents the minimum EPS value. | Reported alongside Basic EPS to give a more comprehensive view of potential impact on EPS if all dilutive securities are exercised. |
EPS From Continuing Operations
Due to market conditions, a company may plan to end some business operations. However, if the operations are not set to end later, the company will still generate earnings from these discontinued operations. In this case, analysts will calculate EPS only based on the company's continuing operations.
This is made by subtracting the income from the discontinued operations from the total income.
The EPS from continuing operations helps understand a company's earnings for the future.
Below is the formula for EPS from continued operations:
EPS From Continuing Operations = (Net Income - Preferred Dividends - Discontinued Operations)/ Weighted Average Outstanding Shares

How to Evaluate Earnings Per Share
A company's EPS is a metric that helps investors measure how much net income a company generates per share. This is an important indicator of profitability.
There are several considerations involved in evaluating a company's EPS, such as:
- A good EPS is not necessarily the highest EPS. The question to ask yourself is, "Is this level of income per share sustainable?" If the company's profitability isn't sustainable, you will likely see a decline in earnings per share over time on a quarter-over-quarter basis.
- A decrease in earnings per share over time indicates growth that is not sustainable.
- Expectations for EPS depend on a company's industry and business model. If it takes time for a company's product or service to become profitable, the earnings per share may be lower initially until the overall profitability is achieved.
- High-growth companies may trade publicly for years without immediately showing positive EPS or EPS growth; however, this does not necessarily mean they are not trustworthy companies.
- EPS Trends are critical for a publicly traded company. Investors like to see sustainable growth in earnings per share. Therefore, a company with a smaller EPS but consistent growth is a positive sign of financial stability, While stagnant or declining EPS could be a red flag for the market.
Limitations of Earnings Per Share
There are some limitations to the use of EPS as a metric. For example, net income is not always a good measure of profitability. Omitting non-cash items and being susceptible to manipulation through accounting methods are limitations of EPS.
Additionally, it does not take into account the time value of money.
Investors need to be careful when interpreting EPS information for specific periods. Earnings can influence the metric due to one-time events or changes in outstanding shares.
For a more comprehensive profitability assessment, investors might consider alternative metrics such as diluted EPS or adjusted EPS.
For these reasons, investors should also consider other profitability measures such as return on equity (ROE) and return on assets (ROA). Comparing various profitability ratios is an effective way to assess profitability.
EPS and Price-to-Earnings (P/E)
The price-to-earnings (P/E) ratio is based on EPS. The P/E ratio reflects market expectations, showcasing how much investors are willing to pay for each dollar of a company's earnings relative to its share price.
To find the P/E ratio, divide the share price by a company's earnings per share (EPS). The P/E ratio is one of the most important metrics investors use. A high P/E may suggest confidence in future growth, while a low P/E could indicate undervaluation.
Relative to competitors, a high P/E may indicate that a company's share price is relatively high compared to its earnings, while a low P/E may suggest the share price is relatively low compared to earnings. However, interpretation should consider industry norms and growth expectations.
The interconnection between EPS and P/E aids investors in assessing both a company's earnings strength and its perceived value in the market.
EPS and Dividends
Dividends are a distribution of a company's earnings. The business can declare dividends to shareholders, or they could reinvest the money back into the company. The number of earnings a company receives will impact the dividends. A company with high earnings per share will likely pay generous dividends.
Earnings Per Share (EPS) and dividends are carefully linked, influencing the income potential for investors. A company's EPS, derived from its net income, contributes to the foundation for dividend payments.
The dividend payout ratio, calculated by dividing annual dividends per share by EPS, gauges the proportion of earnings distributed to shareholders. A robust EPS is important for sustaining dividends, reflecting a company's capacity to generate profits consistently.
Investors scrutinize both EPS growth, dividend yield, and other indicators as measures of financial health and the potential for reliable income.
The relationship between EPS and dividends underscores their combined role in shaping shareholder returns and fostering investor confidence in a company's long-term viability.
EPS Manipulation
Due to the significance of the EPS metric, it can be subject to manipulation through financial accounting techniques.
Companies will attempt to mislead investors by adjusting financial metrics to portray better profitability in their EPS calculations. Some of these manipulation tactics include:
-
Adjusting Share Outstanding: Companies can buy back shares to increase the EPS. Shares Outstanding is in the denominator of the EPS equation. A company's EPS will increase by buying back shares and lowering the denominator.
-
Depreciate Expenses Overtime: Management can decide to treat marketing and other soft costs as assets. If a new marketing project costs $100, then as an expense, it would lower earnings by $100. But if you said the project was a depreciation asset that depreciated over five years. The expense charge would only be $20.
-
Pension Manipulation: If a company offers a pension fund, it can be used as a source of manipulation. The excess can be added to net income if a company has an overfunded fund. This means a company could artificially pad its net income without real changes to business operations.
These manipulation techniques for EPS are significant because they can generate an artificial jump in a company's share price. In addition, finding a manipulation in EPS can help uncover market inefficiencies or an inappropriate valuation for a particular company.


Researched & Authored by Liam
Free Resources
To continue learning and advancing your career, check out these additional helpful WSO resources:


or Want to Sign up with your social account?