I’ve been doing some reading on velocity of M2 Money Stock, and ho hum I can hear your yawns from all the way down here in the Southern Hemisphere. The fact is, I am not an economist, a monetarist or anything in between, thank my lucky stars. But monetarists did pretty well in calling the beginning of the 2007-2009 recession, which followed a surge in the demand of money and a crash in velocity. Why? Mostly because many of us at that time stopped spending and started storing away the few crumbs we had left.
Velocity has a mean of 1.8 since the US started keeping track of it, 50 years ago. Well, hold on to your horses, because the latest chart shows a huge drop in velocity to 1.6, the lowest level since then.
What does all this mean?
Since there is usually a six month lag between the drop in velocity and the peak in economic activity, this could point to the economy peaking in May. The stock market tends to peak two months before economic activity does. March. Ouch!
As a non-economist, I have always liked the Spring for the promise it holds. People start going out, looking at new cars, new Summer homes rentals, and new ways to entertain themselves. So I have a hard time wrapping my head around this potential decline in economic activity beginning in the month of May, at least in the United States.
This constriction of money and decline in velocity is also global. And that’s why the tsunami. China’s M1 shrank in January, and rebounded to ZERO, yes to zero, in February. Europe? Much of the same, and Germany’s promises of austerity measures don’t bode well for velocity. I mean, austere people are not usually the shopaholic kind!
So, why am I mentioning all this? Well, my job is to point things out, and let you decide for yourself. For me, I am going to watch M2 very carefully, velocity even closer, and global consumer spending. If I could help the global economy, I would start spending myself, or travel to Europe and leave those poor people a few crumbs. But the fact is, the last recession left me high and dry.
Pray for even a short-lived global recovery which could stave off the second wave of this tsunami until the fall of 2012. I think this could be a very interesting election year if the United States comes to a screeching halt by, say, October.
Image: Velocity of M2 Money Stock (M2V) (http://i1074.photobucket.com/albums/w416/AndyLouiswso/M2photo.jpg)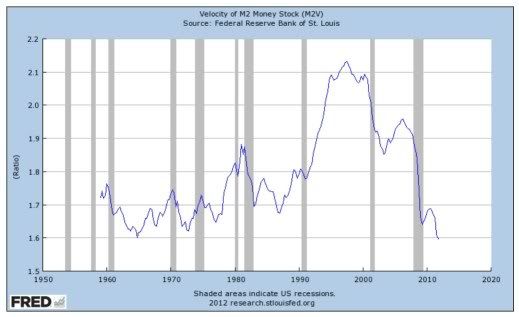


there is no double dip. politicians will do everything to prevent it from happening. so you can stop your thinking now
There's a massive income to obligation disparity that's been growing at an exponential rate that the GOP can make an issue out of in 2016...if this president doesn't get to it first. In the short term, this president has presided during a stabilizing economy, and there's very little that can detract from that perception. The economy isn't going to magically crash in October and get Ron Paul elected no matter how much anyone tries to divine an alternate reality from obscure metrics.
Is everything partisan at this point? What the hell happened to clear thinking people? For the so called "best and brightest" I am not impressed.
Great post!
love this crap, great post. By looking at nothing other than anecdotal observation of the aforementioned chart, it seems as if the velocity of money bottomed years after every recession. If the trough lagged the time in which economists deem the recession to be over and knowing that the years in between recessions economic activity increases, it looks as if we are following the same old pattern and we have nothing to worry about.
Agree. From an amateur interpretation of the chart, it looks like the velocity bottomed out after most recessions. Four or five have a distinct "V" pattern somewhere in the short term after recessions were deemed officially over. What does the economic theory stand on velocity as an indicator for the business cycle?
Also when we look at the massive amount of excess bank reserves in the system then hindsight is 20/20 as to why inflation hasn't gotten that far off core target. My guess here is that this may not be the best indicator of a future contraction. Retail sales and even hiring have improved. I'm more interested in Fed exit strategy as well as inflation expectations, but this is certainly something to watch as well.
Interesting read by the way.
Great post. I agree, everyone thinks that the quantity of currency is what is most important, but it's really the velocity part of the equation.
How does the quantity of currency help if the consumers don't receive any of that money? Who here is short the market now waiting for a crash?
This.
Although you're referring to M2, let's just examine M1 to get a better idea of how immobile the simplest form of money is currently. Since 2008, the Federal Reserve has increased the monetary base by $1.88 trillion (a 188.4% increase from previous year), but the M1 money supply only grew by $766.9 billion (a 55.6% increase from previous year). The M1 multiplier is clearly less than one, and if we examine it further, everything else in the multiplier seems to be behaving expectedly (statistically speaking) with the exception of the excess reserves ratio. If we examine the correlation between the monetary base and the quantity of excess reserves from Feb 1995-Aug 2008, the regression would equal 0.3. If we examine the correlation between the monetary base and excess reserves from Sep 2008 - Present, we would obtain a regression equal to 0.998. Banks today are accepting the Fed's money and depositing it right back at the expense of 0.25% interest.
So long as the Fed closely examines the behavior of banks with respect to mobilizing the giant monetary base, and carefully conducts contractionary monetary policy with enough leeway to facilitate stimulus, we should do well with controlling inflation and keeping GDP growth in the green.
WS juices it's bonus pool by borrowing the Fed, levering up, and buying Ts. That spread made up like 15% of the street's bonus pool last year.
Fed can't control velocity, so they never talk about it. Things could eventually get out of hand.
How does M3 look?
This chart does not make me worry about a double dip... It makes me worry a lot more about inflation... What is going to happen when velocity goes up to mean of 1.8? Or to pre-crisis 2+? Would we just have high inflation or stagflation?
The Bernanke is going to keep printing until we have either hyperinflation or default. the rule of law needs to be reinstated and the bankers need to be prosecuted
Wait, you are using velocity of money to predict a recession? You know that velocity of money is comprised of three components: Price, GDP and M1 (or M2) and the formula is Nominal GDP/ M1 (or M2). Prices are stagnant. GDP is only rising moderately. Thus the numerator has not increased. But M1 and M2, especially M1 have risen quite a bit. What happens when the denominator of a quotient gets bigger? I'm not a math major but I think the answer gets smaller.
Then you talk about China's M1 decreasing. The Chinese have direct control over M1, the reason it decreased was because they wanted it to decrease ( idk but they have had a little inflation issue).
Also using a mean over 50 years of data seems a little absurd. It is like using 50 years of data to calculate the Rfr and Market premiums in wacc.
Your thoughts on Europe and focusing on retail sales seemed spot on though.
I am curious as to the thoughts of the people who thought this was such a great article..?
a large portion of the money supply is being kept as excess reserves that banks collect interest on, which means it isn't in circulation this is dragging down the velocity as long as there are a lot of excess reserves, velocity should be lower than historical averages
If you want to measure the banks lack of willingness to lend ( why they so many ER) you use the money multiplier.
Est aut voluptatem excepturi illum sit. Deleniti incidunt sapiente animi sapiente vel perferendis itaque. Et et voluptate natus nihil labore voluptate ut impedit. Aut qui nemo dicta quo quis delectus facere. Labore laudantium consequatur provident fugiat minima tempore et. Iure asperiores quod et ut. Sint est nemo voluptates est mollitia voluptatem nihil.
Sit est reiciendis molestias. Et ut blanditiis quibusdam consequatur ex voluptas qui. Quia optio et omnis aut aliquam. Enim adipisci aut neque debitis.
Aut sint ut reprehenderit eligendi cupiditate. Sed fugit voluptas consequatur quaerat labore eaque.
See All Comments - 100% Free
WSO depends on everyone being able to pitch in when they know something. Unlock with your email and get bonus: 6 financial modeling lessons free ($199 value)
or Unlock with your social account...