YIELD Function
A financial function that calculates the yield on debt instruments, making a coupon payment for the investors


What is the Excel YIELD Function?
The YIELD is a financial function that calculates the yield on debt instruments, making a coupon payment for the investors.
The return on an instrument that generates recurring interest payments, such as a bond, can be calculated using Excel's YIELD function.
Excel Financial functions include the YIELD Function. It will determine the yield on a security that accrues interest on a recurring basis. Bond yield is often calculated using the function. As financial analysts, we frequently compute a bond's yield to ascertain the annual revenue that would be produced.
Yield is a confusing term, and many people think of it as the rate of return. However, yield is the expected income that an investment will generate in a period.
It is usually expressed as a percentage and helps the investor decide whether a particular security is profitable compared to its alternative.
Generally, when you decide to calculate the yield on security, particularly a fixed-income security, you ask what the returns will be in the form of bond price appreciation and coupon payments.
Dividends paid and equity price growth are considered when discussing yield in terms of equity.
Thus, in general, if we were to speak about yield, it means any price increase along with dividends and coupons paid to the investors divided by the principal amount invested in the security.
We can determine whether or not the terms yield and rate of return are equivalent or dissimilar by comparing them.
In this article, we will see the YIELD function, its syntax, and a couple of examples to see how the function works.
- The YIELD function calculates the yield for debt instruments making a coupon payment to the investors.
- The yield is inversely proportional to the price of the bond. If the price of the bond increases, the former falls, and vice versa.
- You can input the settlement date and maturity date using the DATE function, which will avoid getting an error for inconsistent date formats.
- The settlement date should not be equal to or greater than the maturity date, or the function will return the #NUM! Error.
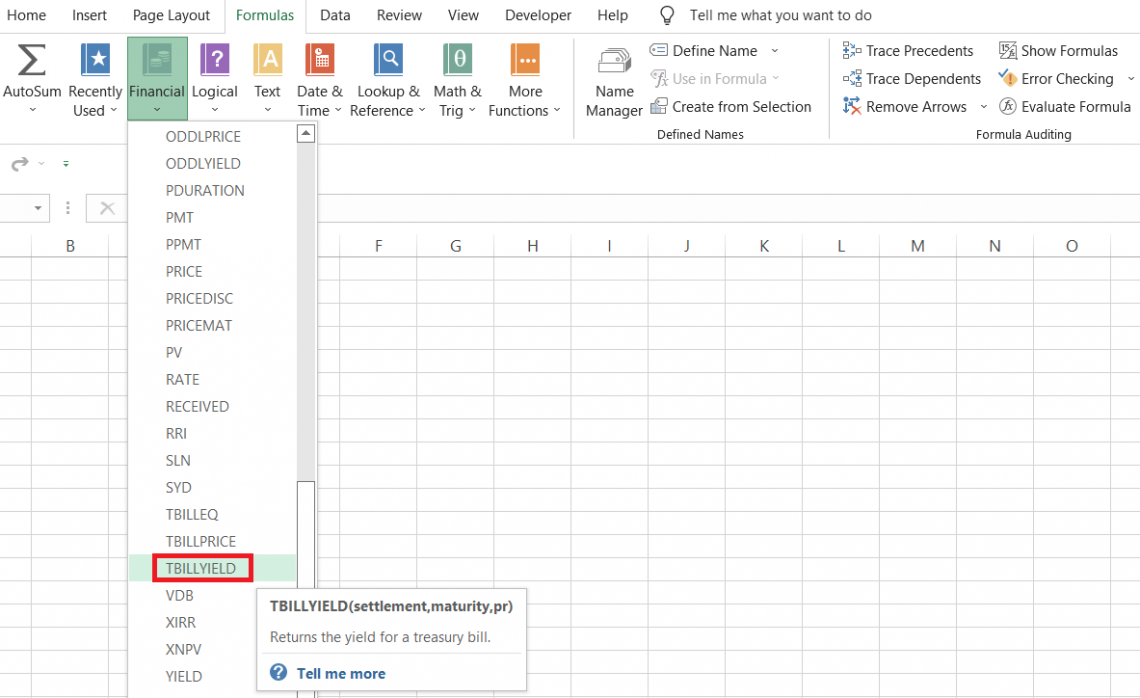
- The yield for the treasury bills can be calculated using the TBILLYIELD function.
Understanding the Excel YIELD Function
The YIELD is categorized as a financial function that calculates the yield of debt instruments, making a coupon payment to the investors.
The function accepts seven different arguments, including the settlement date, maturity date, the bond's interest rate, price, redemption value, frequency of coupon payments, and the day count basis.
Yes, the function might look a bit complicated based on the number of arguments you might need to look at, but once you get the hang of it, it will be a piece of cake.
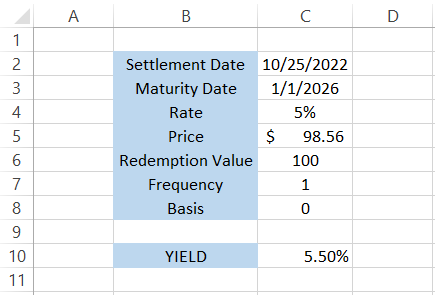
For example, suppose that you have the data as illustrated below:
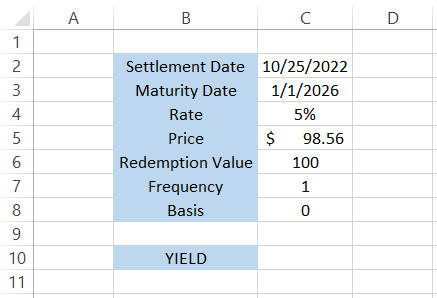
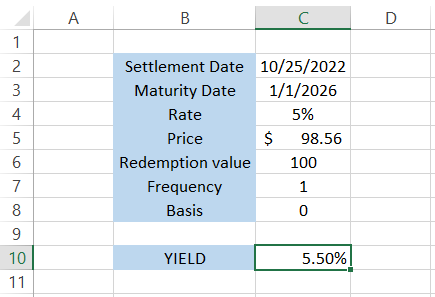
If we were to calculate the yield on the bond using the function, we would get the result of 5.50%.
On the other hand, the rate of the return for the bond will be equal to the following:
= (100 + 5 + 5 - 98.56) / 100
= (110 - 98.56) / 100
=0.1144 or 11.44%
Thus, the rate of return is 11.44%, where the bond makes two annual coupon payments of $5 with a capital gain of $1.46 from $98.54 to a redemption value of $100.
To conclude, the yield is a prospective return on the fixed income instrument, while the rate of return is the actual net gain or loss already earned for a while.
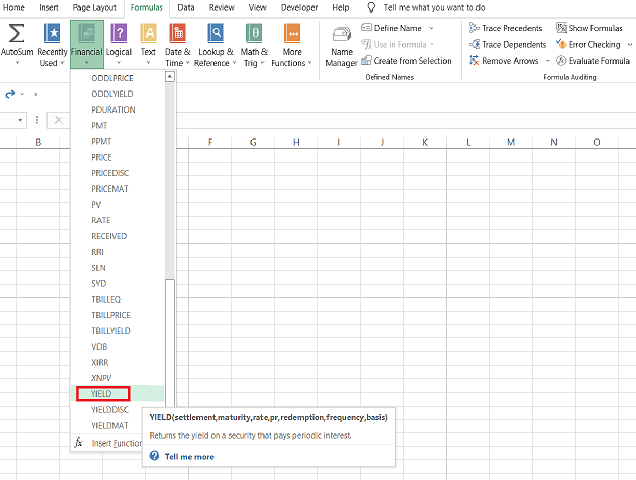
The syntax for the function is:
=YIELD(settlement, maturity, rate, pr, redemption, frequency, [basis])
where,
- settlement: (required) settlement date of the bond
- maturity: (required) maturity date of the bond
- rate: (required) the interest rate that the bond pays to the investor, also called the coupon rate
- pr: (required) price of the bond
- redemption: (required) redemption value of the bond per $100 face value
- frequency: (required) the number of coupon payments each year
- basis: (optional) day count basis, where 0 equals the default value
The basis argument can only accept five different values as below:
| Basis | Day Count |
|---|---|
| 0 | US (NASD) 30/360 |
| 1 | Actual / Actual |
| 2 | Actual / 360 |
| 3 | Actual / 365 |
| 4 | European 30 / 360 |
Yield vs. Rate of Return
We saw the yield on security, but how does it differ from the rate of return?
Although both financial terms refer to income earned on the investments, the major difference is that the rate of return considers capital gains for security while the yield does not.
In simple terms, a capital gain is an increase in the value of an asset. For example, you buy land for $400,000 and sell it for $500,000, and then you make a capital gain of $100,000. Here, our asset has increased in value by $100K over a given period.
If you buy the CitiGroup Inc stock for $50 that paid you a dividend of $2 twice and then sell it for $60, then the rate of return on the stock would be given using the formula:
= (Final stock price + Dividends - Initial stock price)/Initial stock price
=(60 + 4 - 50)/ 50
= 0.28 or 28%
Thus, the rate of return on the given stock will be 28%.
On the other hand, if you were to calculate the yield of a $100 bond paying a 5% annual coupon to the investors, it would be equivalent to the ratio of coupon payments to the principal amount paid for the bond.
The formula to calculate the yield will be:
= (Coupon payments/Principal amount invested in the bond) x 100
= (5/ 100) x 100
= 5%
Thus, the yield on the bond will be equal to 5%.
If you purchase the bond on the secondary market, the price of the fixed-income security might fluctuate. For example, suppose two bonds are priced at $103 and $98, paying 5% and 5.25% annual coupons, respectively.
What do you think will be the yield on both bonds?
If we use the above formula, the yield on the two bonds will be 5.00% (5.15/103 x 100) and 5.25% (5.145/98 x 100), respectively.
We see that the yield on the latter bond with a price of $98 is more than the one with a price of $103, paying the investors a 5% annual coupon.


How to Use YIELD Function (Step-by-Step)
Reading the syntax for a function is one thing and using it in a real-world scenario is quite another. Many people would agree that the confusion related to using an Excel function is directly proportional to the number of arguments in the function.
The SUM and INDEX-MATCH functions are an illustration. SUM has only one argument - the value that can be referenced as a range of cells. As a result, almost all Excel users, even beginners who have never used Excel, know about it.
On the other hand, INDEX-MATCH requires you to input multiple arguments, and despite its numerous advantages, most users prefer the VLOOKUP or HLOOKUP function.
Well, returning to our YIELD function, if you intend to use the function as a worksheet formula, please follow the steps below:
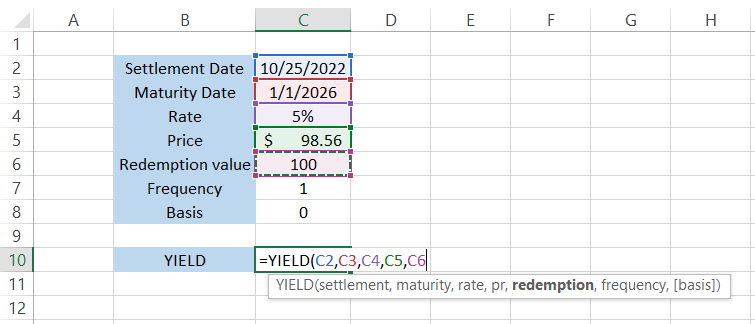
Suppose that you have the data in Excel as illustrated below:

Settlement
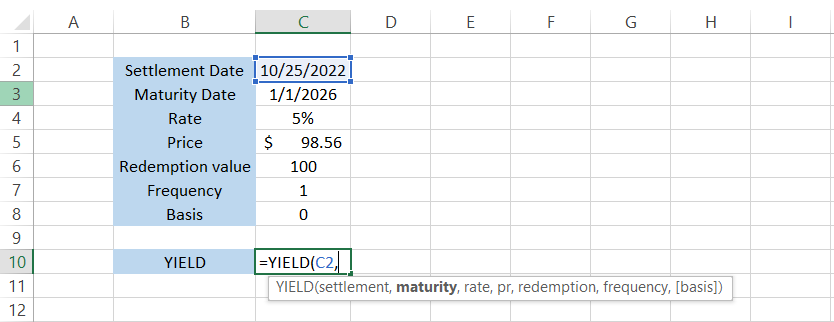
As the name suggests, the settlement argument means the settlement date of the bond. This is usually the T+2 day when the ownership of the bond is transferred.
For example, suppose you purchased the bond on 10/22/2022 for $98.56. This is the purchase date and purchase price, respectively.
When the seller on the secondary market receives money, the bond automatically gets transferred to your holding account.
Many transactions go on behind the scenes to settle the trade for both parties involved, i.e., the buyer and seller, after which each receives securities or cash on T+ 2 days.
The settlement date in our data is in cell C2. We will reference the cell in formula =YIELD(C2, maturity, rate, pr, redemption, frequency. [basis]) as:
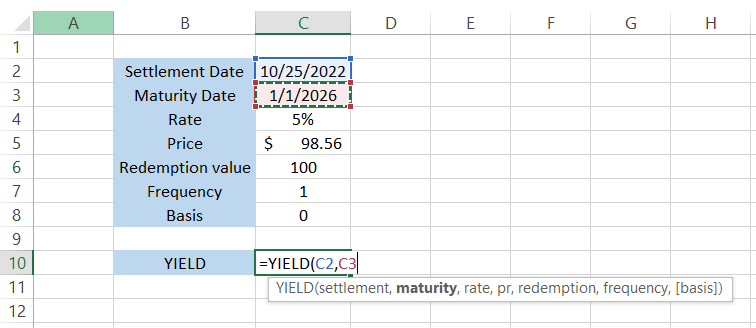
Maturity
This refers to the maturity date of the bond. Different bonds have different maturity dates from the date of their issue. For example, a 10-year bond issued in 2022 will mature in 2032. In our case, the bond's maturity date is equal to 01/01/2026.
The updated formula in cell C10 becomes =YIELD(C2,C3, rate, pr, redemption, frequency. [basis])
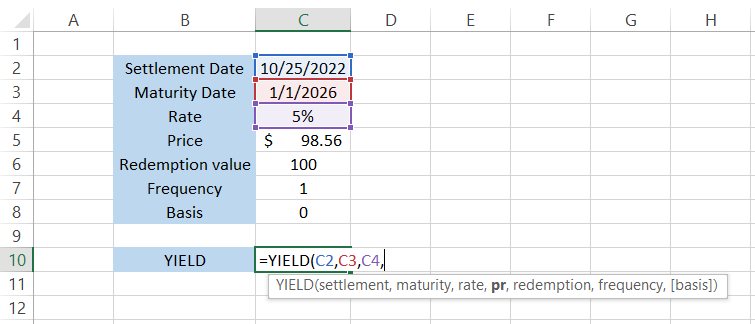
Rate
The rate will be the coupon payment guaranteed to the investor each year. It is usually expressed in a percentage of the bond's face value.
For example, a coupon of 5% on a $100 bond means that the investors will be entitled to $5 each year, along with $100 at maturity.
The coupon can either be paid annually, semi-annually, or quarterly, depending on the terms of the bond between the lender and borrower.
Our rate is equal to 5%. By referencing the cell C4, we get the formula =YIELD(C2,C3,C4, pr, redemption, frequency. [basis]).
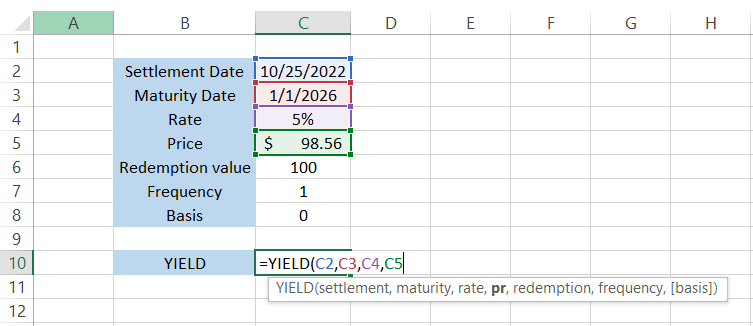
Pr
The function will represent the bond's current price as the pr argument. So, for example, the price of our bond is equal to $98.56, as in cell C5.
The formula becomes =YIELD(C2,C3,C4,C5, redemption, frequency. [basis]) as shown below:
Redemption
The redemption argument tells what the face value of the bond will be at the maturity date. For example, we know that all the $100 denomination bonds mature at $100, even if they are issued at either premium or discount.
Currently, our bond is trading at a discounted price of $98.56. However, we expect to receive a $100 redemption value at maturity.
The formula becomes =YIELD(C2,C3,C4,C5,C6, frequency. [basis])
Frequency
The final required argument is the frequency which tells how many times the coupon was paid to the investor. As we said earlier, the frequency of coupons may vary from bond to bond, but the most common is the annual coupon payment or once-a-year payment.
Based on the frequency, the function accepts three values - 1 (Annual), 2 (Semi-Annual), and 4 (Quarterly). The function shows a drop-down menu to select the value instead of a cell reference, as illustrated below:

The formula becomes =YIELD(C2,C3,C4,C5,C6,1. [basis]), after which you can directly press the Enter key, and you would get the result as 0.0549832 or 5.50%.
Basis
The basic argument is an optional parameter that lets you decide the day count basis for the calculation of yield on the bond.
Here, we will see what each basis value means so that it becomes easier to make decisions while using the function.
- US (NASD) 30/360 - Each month consists of 30 days and 360 days in a year. It is the most commonly used method for US corporate bonds.
- Actual / Actual - Includes the actual number of days for the accrual period and year. Treasury bonds and notes yield can be calculated using this method, although it is not a necessity.
- Actual / 360 - Actual number of days is used for an accrual period with 360 days in a year.
- Actual / 365 - Actual number of days is used for an accrual period with 365 days in a year.
- European 30/360 - Each month has 30 days, with 360 days in a year.

Example of YIELD function
Now we know how to use the function, let's see how you can apply it in a real-life scenario and make informed investment decisions.
Suppose you are looking to invest in a 10-year bond from two alternatives available on the secondary market (mutually exclusive investment). The data looks as illustrated below:
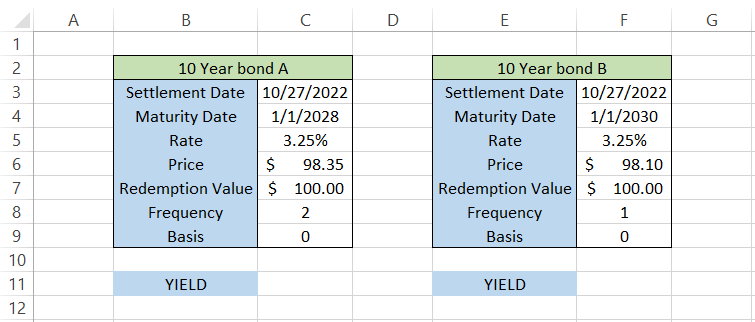
We see that both bonds mature on different days and make different numbers of coupon payments each year, but the only thing that remains constant is their coupon rate and redemption value.
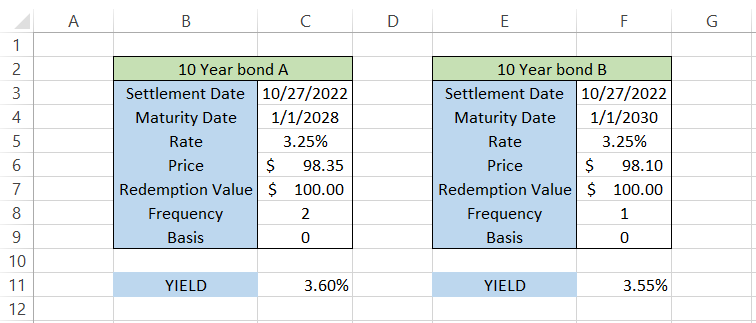
By using the formula =YIELD(C3,C4,C5,C6,C7,2) in cell C11, we get the result as 3.60%. On the other hand, using a similar formula =YIELD(F3,F4,F5,F6,F7,1) in cell F11, the result is equal to 3.55%.
Although there is not much difference between the two 10-year bonds, A offers a greater yield to the investor than the 10-Year bond B.
It is important to remember that yield is an expected return that the bond will generate over time.
The bond yield tends to go down when the price of the bond increases, whereas the bond yield goes up if the bond price falls.
The 10-year treasury yield is an important indicator of the market or economy. When the bond yield increases with a price fall, it indicates investors' confidence in the market and vice versa.
Note
Date formats play an integral role when you reference the maturity and settlement argument in the function.
A simple error of representing the dates in dd-mm-yyyy instead of mm-dd-yyyy can return a result while using the YIELD function.
To avoid this, you can use the DATE function to input dates in the cell or directly in the formula. For example, 1st January 2022 can be input using the formula =DATE(2022,1,1)
TBILLYIELD vs. YIELD Function
T-bills are short-term bonds with maturity ranging from 30 to 364 days that are usually issued at a discounted price from their face value.
Do t-bills not make a coupon payment to the investors, which makes us think: How do we calculate the yield on those financial instruments?
The TBILLYIELD is a financial function that will let you calculate the yield on treasury bills based on three components - the settlement date, maturity date, and price of the T-bill.
The syntax for the function is
=TBILLYIELD(settlement, maturity, pr)
where
- settlement - (required) the settlement date of the T-bill
- maturity - (required) the maturity date of the treasury bill
- pr - (required) the price of the T-bill
An important thing to remember regarding the maturity date is that it should not be more than 364 days. Otherwise, the function will return an error. Similarly, the settlement date should not be equal to or greater than the maturity date.
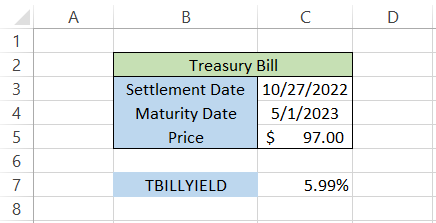
Let's see an example to see how the function works. Suppose you have the data in Excel as illustrated below:
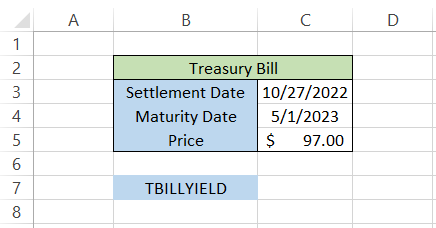
By using the formula =TBILLYIELD(C3,C4,C5) in cell C7, we get the yield on the T-bill as 5.99%
Would you still be able to calculate the T-bill yield using the YIELD function? Let's try and see if it is possible.
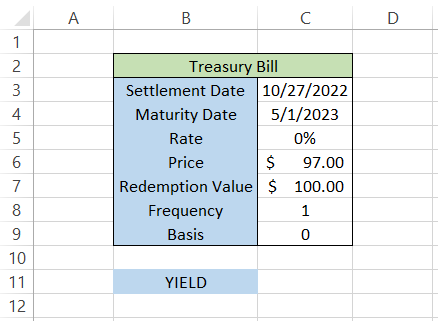
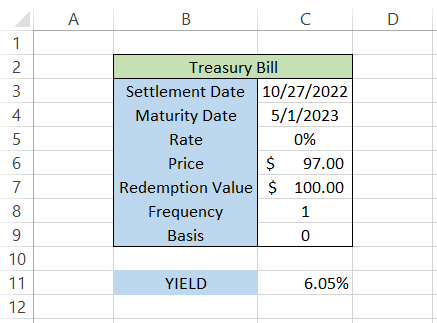
Let's understand the data illustrated above.
- We kept the coupon rate as zero since the T-bill does not make coupon payments to the investors and, instead, is issued at a discounted price.
- Since the accrued income will be paid at maturity, we have set the frequency value to 1 (annual payment).
The formula to calculate the yield will be =YIELD(C3,C4,C5,C6,C7,1) in cell C11, which gives the result of 6.05%.
Although there is not much difference between the results returned by either function, it is still advisable to use the functions that apply to bonds and T-bills, respectively.


or Want to Sign up with your social account?