QUARTILE Function
An Excel Statistical Function that aids in finding the quartile values for the given data set.


What is the QUARTILE Function?
The QUARTILE function is an Excel Statistical Function that aids in finding the quartile values for the given data set. The function divides the data into 4 parts equally, with each part representing a data set.
The function provides the result by returning the minimum value based on the mentioned quartile value.
But what exactly is a quartile?
Think of the concept as four different compartments. Let’s take an example of age groups to understand what quartiles are. Suppose that you have four age groups
- Age 0-12
- Age 12-21
- Age 22-48
- Age 49 and above
If you were to categorize these ages, then Age 0-11 represents the first group, Age 12-21 describes the second, Age 22-48, and Age 49 and above represent the third and fourth quartile group, respectively.
In the same way, when you say that the function finds the group for the range of values, you see the values that fall into particular compartments.
Quartiles and percentiles are somewhat synonymous with one another. Percentiles divide the dataset into 100 equal parts, whereas its counterpart divides the data into four parts.
There are three different quartiles, along with the minimum and maximum values.
- Minimum value - As the name suggests, the function would return the minimum value from the range of values.
- 1st Quartile(Q1) - Q1 represents the 25th percentile meaning that 25% of the values in the data fall below the value returned.
- 2nd Quartile(Q2) - Q2 represents the 50th percentile meaning that 50% of the values in the dataset fall below the value returned. It also describes the median or the middle value in the entire dataset.
- 3rd Quartile(Q3) - The Q3 represents the 75th percentile meaning that 75% of the values in the dataset fall below the value returned.
- Maximum value - The maximum value in the entire dataset.
In this article, we will understand the syntax for the function, how to use it, and a couple of examples to understand it better.
- The QUARTILE function is a Statistical Function in Excel that calculates quartiles for a dataset by dividing it into four equal parts.
- Users provide arguments, including the dataset and the quartile number (1 to 4). It returns the value corresponding to the specified quartile.
- Users might encounter potential errors when using the QUARTILE function, such as providing invalid input values or referencing cells with incorrect data and not knowing how to address them effectively.
- QUARTILE function finds applications in statistical analysis, hypothesis testing, and quality control, where understanding data distribution into quartiles is essential for making data-driven decisions and drawing statistical inferences.
Understanding The QUARTILE Function
A quartile function is primarily categorized as a statistical function that returns the quartile for a range of values.

However, if you access the function from its library, you will find it under the Compatibility section since an upgraded version replaces it.
Still, Excel supports functions to use in case one of your clients uses an older Excel version, whereas you use a newer version.
The QUARTILE function was replaced by QUARTILE.EXC and QUARTILE.INC function for better accuracy and understanding of what the function could do.
The newer functions were introduced in Excel 2010, while the former was a compatibility function.
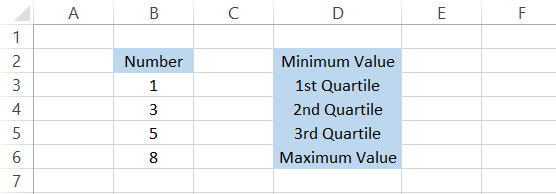
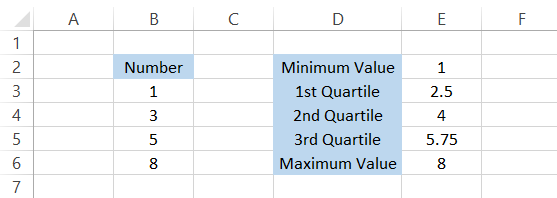
Suppose you have the range of values as 1, 3, 5, and 8 and need to find all three groups as well as minimum and maximum values.
Now, the minimum and maximum values are easy: 1 and 8, respectively. The tricky part is understanding the interpretation for the other three groups.
The value Q1 would be equal to 2.5, meaning 25% of the values in our dataset fall below this number. True; there is just one number, i.e., 1, that falls below this number.
Similarly, the value for Q2 and Q3 would be equal to 4 and 5.75. As per Q2, only two numbers, i.e., 1 and 3, that constitute 50% of the total values fall below the number 4. Hence, another interpretation proved to be true.
Finally, 5.75 has three numbers below it, 1, 3, and 5, constituting 75% of the total numbers in the given range.
Although interpreting the quartiles and percentiles can be quite confusing, the same concept applies to the variable range of values in the dataset.
The syntax for the function is
=QUARTILE(array, quart)
where,
- array = (required) reference to the range of values in a dataset
- quart = (required) refers to the quartile value which we intend to return
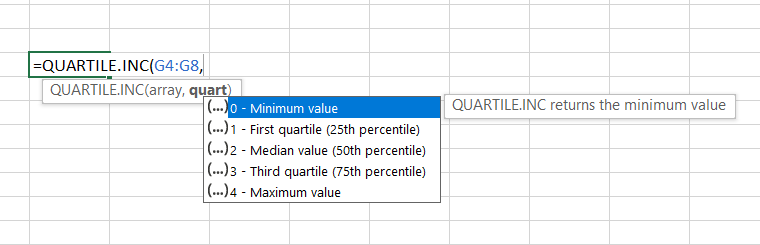
The quart accepts only five different values, as illustrated below:
| Value | Quart |
|---|---|
| 0 | Minimum Value |
| 1 | Q1 - 25th percentile of values lie below this number |
| 2 | Q2 - The 50th percentile of values lies below this number |
| 3 | Q3 - The 75th percentile of values lies below this number |
| 4 | Maximum Value |

Example of the QUARTILE function
Most Excel functions are more straightforward if you know what the respective functions do.
The QUARTILE function is no exception to this fact. You can use the function in two different ways:
- Formulas tab > More functions in functions library > Compatibility, and click on the function.
- As a worksheet formula.
Most Excel users prefer the second method since it offers more flexibility to accommodate and nest different functions than the first.
Example #1
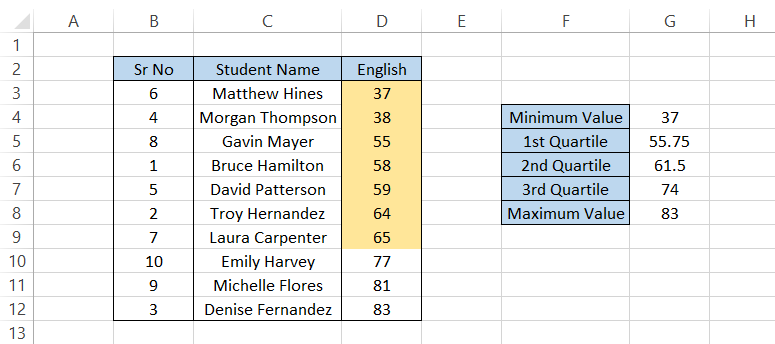
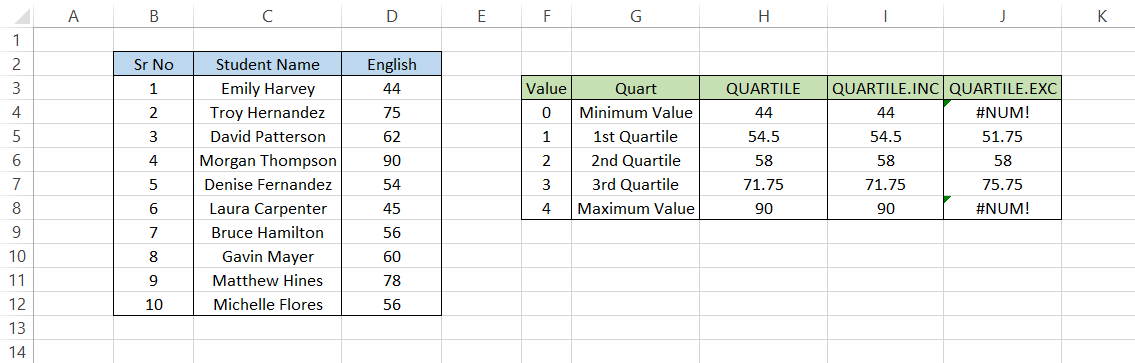
Suppose that you have the student's test scores for English subject as illustrated below:
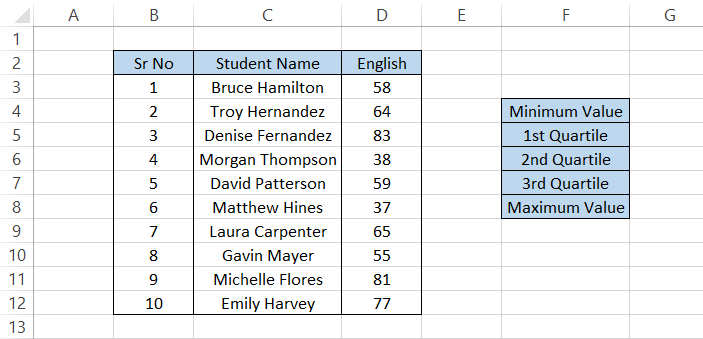
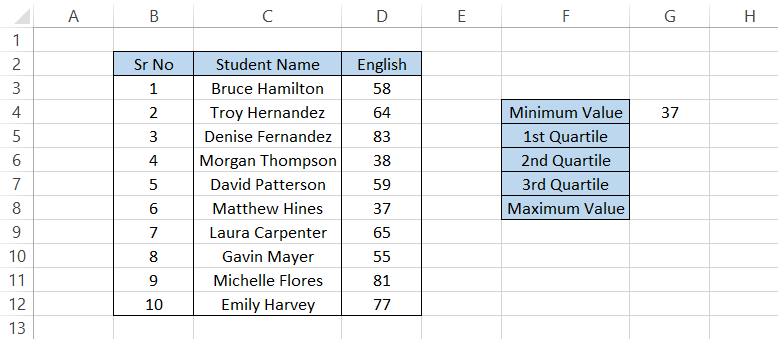
To find the result, we will use the formula =QUARTILE($D$3:$D$12,0) in cell G4, which gives us the minimum value:
Similarly, by changing the quart argument in the formula, the rest of the values would be:
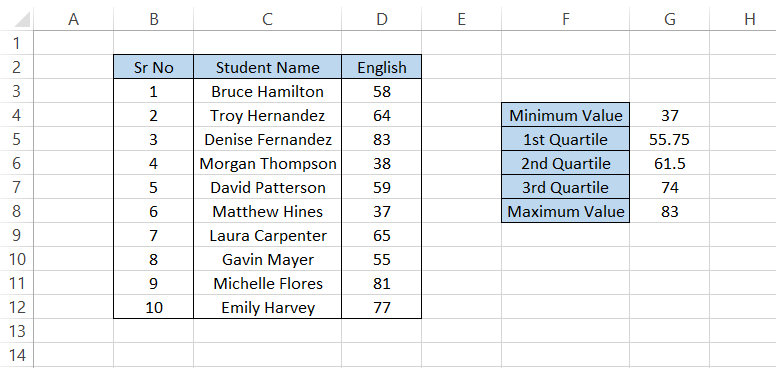
A bit difficult to understand, isn't it? However, the maximum and minimum values are easy to interpret because you look for those values directly in the range.
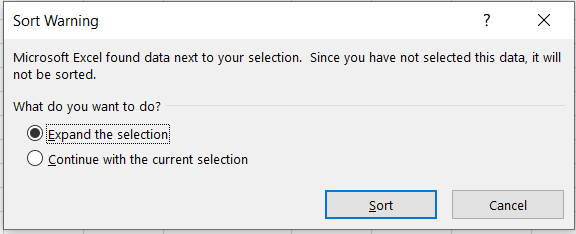
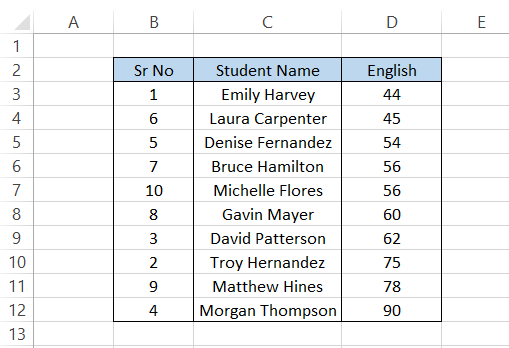
Using the Sort function, let's try to rearrange column D in ascending order. First, select the range D2:D12 and then press the keyboard shortcut of Alt + H + S + S.
Select 'Expand the selection' and press Sort.
The Sort function will give the test scores in ascending order, as illustrated below:
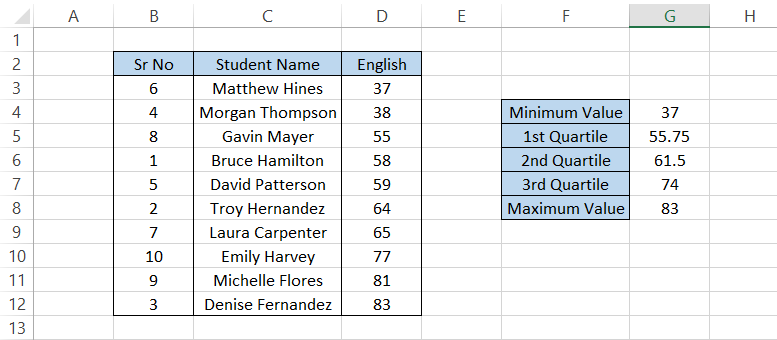
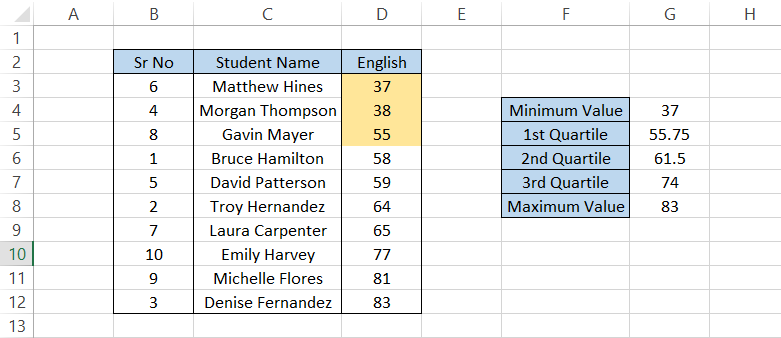
Minimum and Maximum Value as per the ascending order table - Check. Next, we will see the Q1, which is equal to 55.75. Since we have 10 values, each value represents 10% of the range.
Therefore, the value of 55.75 has 37, 38, and 55 below it, which roughly constitutes the 25th percentile or the Q1 compartment.
Q2 is equal to 61.5. Test scores 37, 38, 55, 58, and 59 lie below them, which accounts for half of the values in the datasets. Thus, it represents the numbers below the 50th percentile or the median.
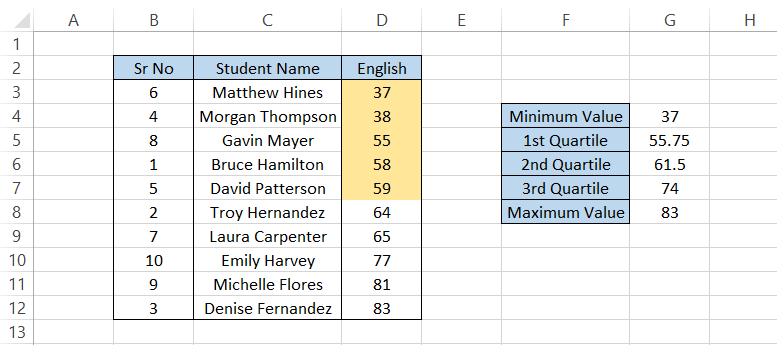
The Q3 is 74 and has 37, 38, 55, 58, 59, 64, and 65 numbers, roughly representing around the 75 percentile of data below our Q3.
Note:
You don't need to sort the data in ascending order while using the function. In our example, the data is arranged in ascending order to understand better what goes behind the scenes when you use the formula in Excel.
Example #2
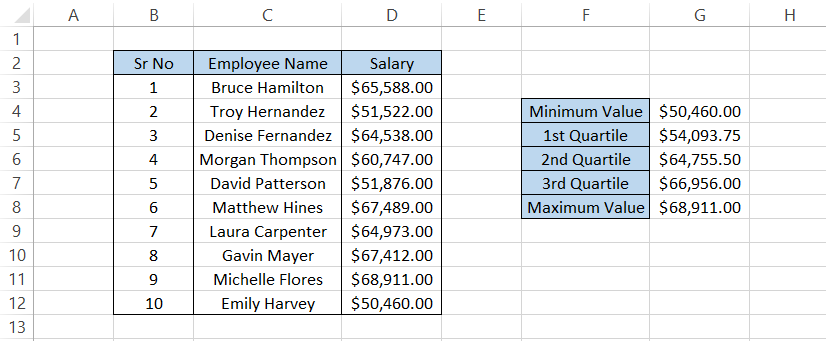
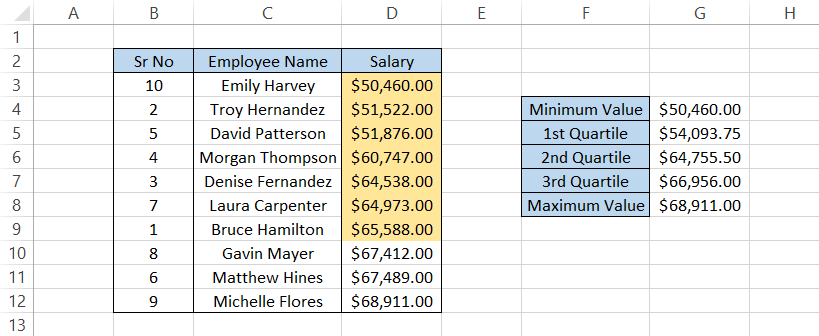
Suppose that you have the salaries for the ten employees in your organization as illustrated:
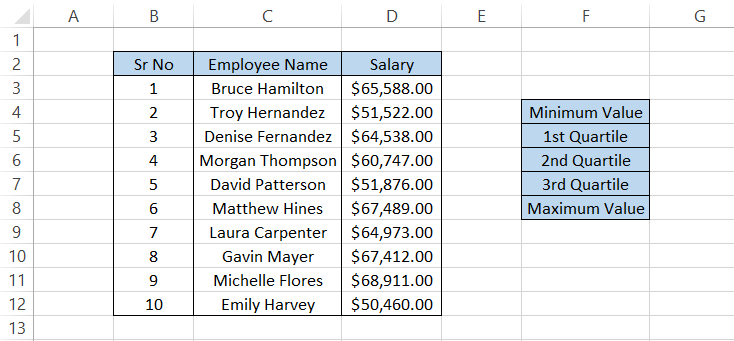
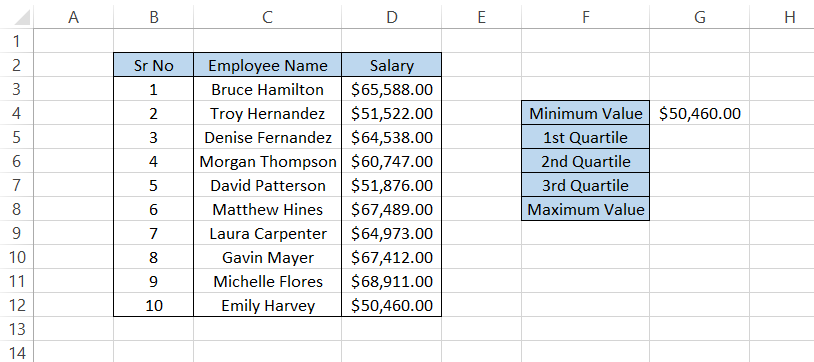
To find the minimum value, we will use the formula =QUARTILE($D$3:$D$12,0) in cell G4, which gives the result as
Similarly, you can find all the values by changing the quart argument in the function and dragging down the formula to cell G8 as
Now, let's check whether the function worked! First, we will sort the range D3:D12 in ascending order using the keyboard shortcut Alt + H + S + S.
The sorting tool should give us the table, as illustrated below:
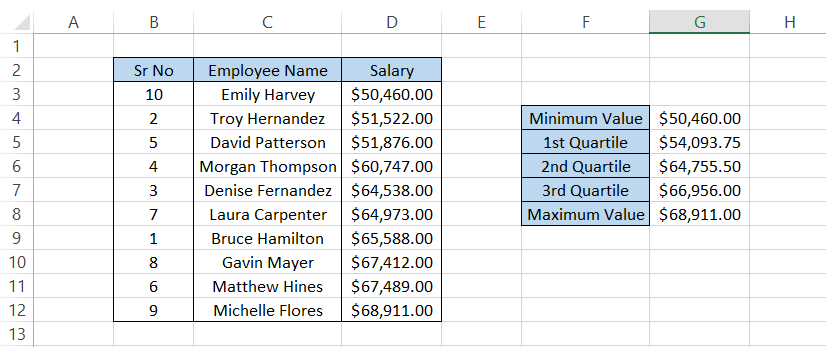
Again, the minimum and maximum values are crystal clear since they would be our dataset's first and last numbers.
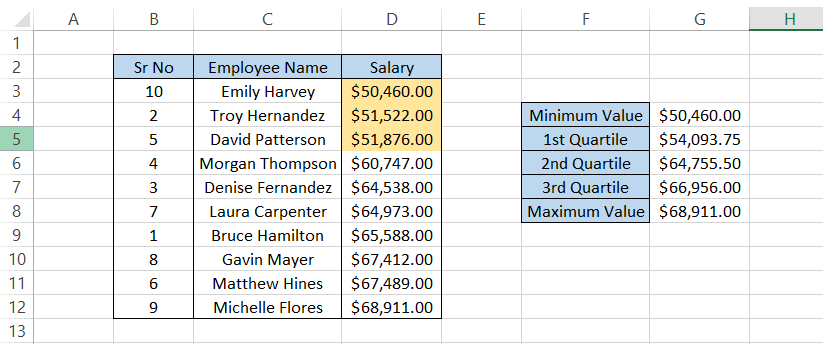
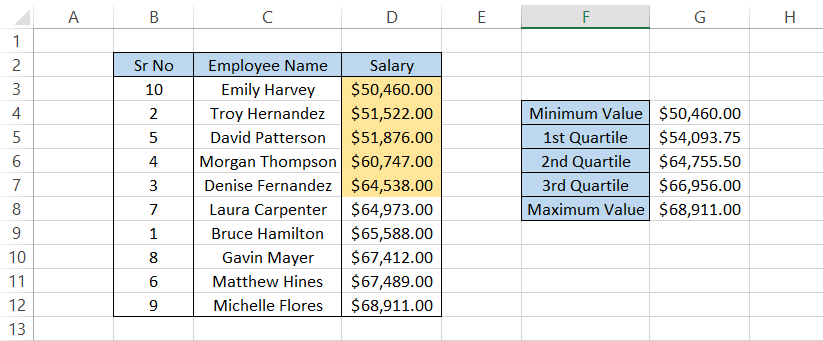
With Q1 equal to $54,093.75, we have three employees earning below that number. Therefore, Q1 means these three employees constitute 25% of the lowest-earning employees.
The Q2 is $64,755.50, which constitutes the 50th percentile value. Half of the employees from the dataset earn below this number.
Finally, the Q3 is $66,956, and we would find 75% of employees earning below this number. Once you get the hang of interpreting the result, it becomes easy to understand such problem sets.
It will take some practice to master the interpretation of the function's result, but we can guarantee that once you start, you will become a wizard in no time!

QUARTILE.INC and QUARTILE.EXC
These functions are the newer version of our compatibility function QUARTILE. So the question is: If the previous function was working fine, why was there even a need to introduce two different functions in its place?
The answer is simple. Excel wanted to offer its users more flexibility in the result that the person obtains. So half of the meaning of what each function does is in its name itself.
QUARTILE.INC function allows the user to find the minimum and maximum value of the original referenced range. For example, if you have the range as 1,2,3, and 4, the function can return the minimum and maximum values as 1 and 4, respectively.
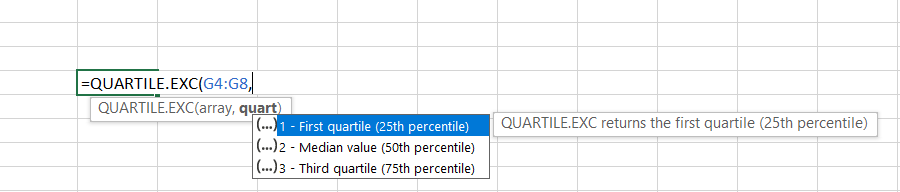
On the other hand, when you use the QUARTILE.EXC function excludes the 0 and the 100th percentile from the result, i.e., the minimum and the maximum value. The function would return only three quartiles, where Q2 would be the median or the 50th percentile and the rest of the quartiles lying on either side.
The syntax for both functions is:
=QUARTILE.INC(array,quart)
and
=QUARTILE.EXC(array,quart)
where,
- array = (required) reference to the range of values in the dataset
- quart = (require) refers to the quartile value that we intend to return
As we already know, there are a limited number of arguments that you can use for the quart.
If you use QUARTILE.INC, you can use five different values for the quart argument of the function.
On the other hand, QUARTILE. As a result, EXC only offers us three inputs for the quart argument, as illustrated below:
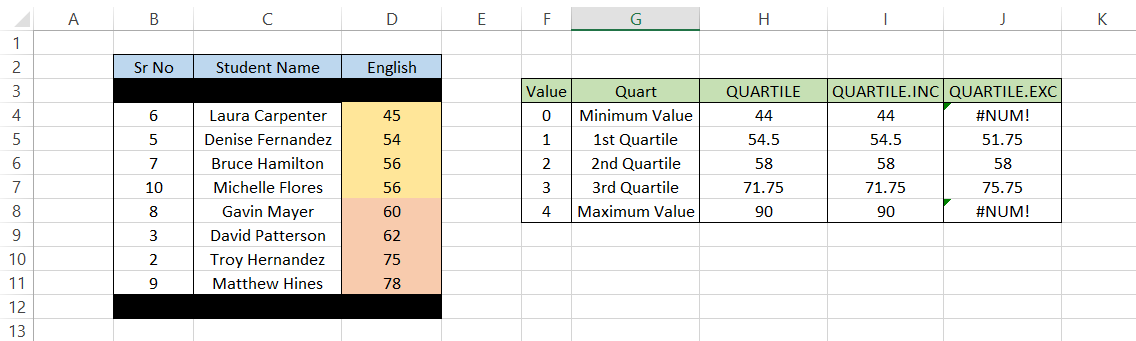
Let's see an example and see what type of contrasting result we get using both functions. Suppose you have the data as illustrated below:
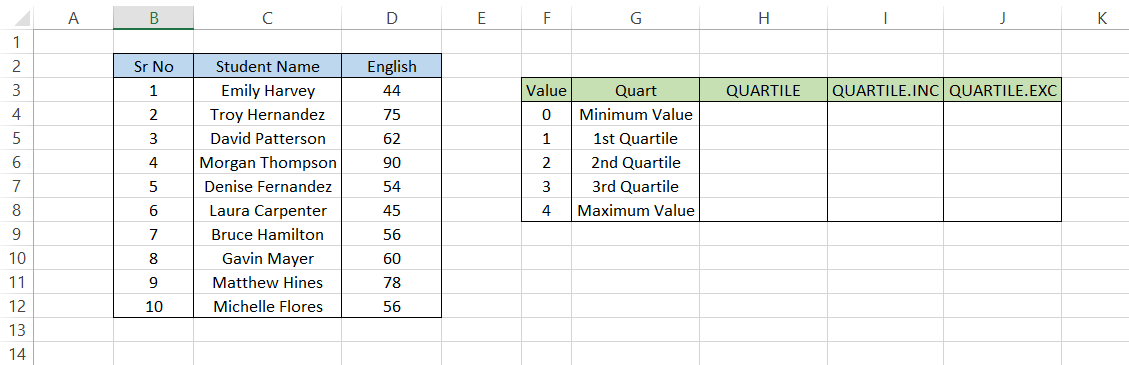
The QUARTILE.INC works similarly to QUARTILE, so we would see the same results for both functions.
The formula to get the result in the H and I columns would be =QUARTILE($D$3:$D$12,F4) and =QUARTILE.INC($D$3:$D$12,F4) respectively, which gives the result:

Next comes the tricky part. We use a similar formula =QUARTILE.EXC($D$3:$D$12,F4) in cell J4 and drag it down to the last cell to get the result:
We get a #NUM! Error for the minimum and maximum value, while the Q2 is the same.
We see a significant difference for Q1 and Q3 with values of 51.75 and 75.75, respectively.
How do we interpret both of these values?
First, let's arrange the range D3:D12 in ascending order. Then, we will use the keyboard shortcut of Alt + H + S + S, which gives us the result:
We had mentioned that QUARTILE. Therefore, EXC excludes the 0th and 100th percentile from the result even if we reference those values.
After excluding the minimum and maximum values, we get the table:
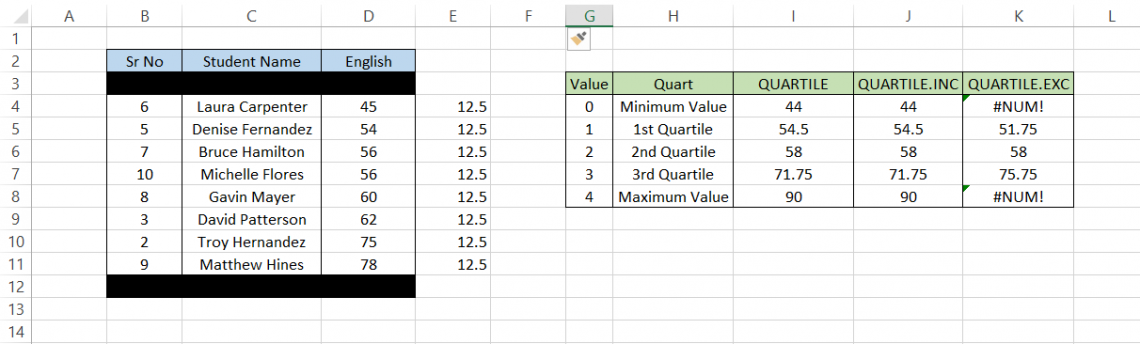
We have eight values left in the range where each value constitutes 12.5% of the total value. Ultimately, this affects the Q1 and Q3 for our dataset.
Q1 equals 51.75, with only one value 45 below the number.
Since a single number constitutes 12.5%, the constitution would have gone over or equaled 25% if there were two numbers, which defies the quart logic.
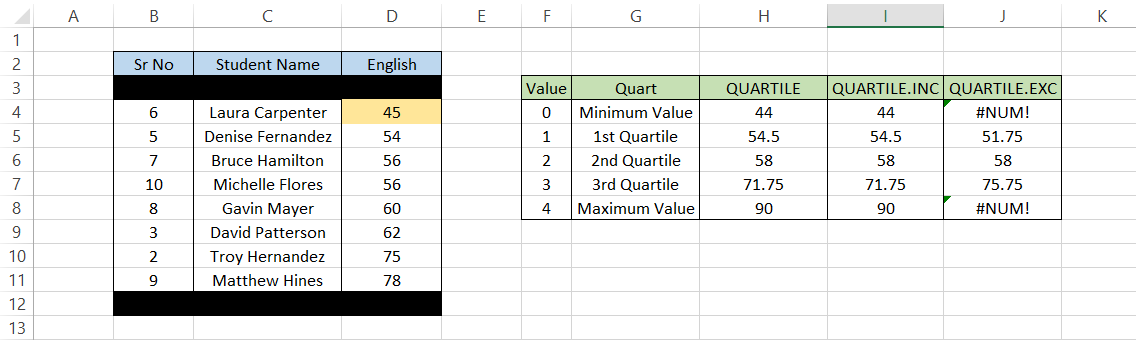
Similarly, Q3 has values 45, 54, 56, 56, 60, 62, and 75, which constitute above 75%. So now you would ask why the add up to is greater than 75%.

Well, the same logic of Q1 applies here. If two numbers had been included, it would defy the logic of quart in this particular example.
The Q2 is 58, where the range is equally divided on either side, with 45, 54, 56, 56 on the Q1 side and 60, 62, 75, and 78 on the Q3 side.
Free Resources
To continue learning and advancing your career, check out these additional helpful WSO resources:


or Want to Sign up with your social account?