TBILLYIELD Function
It calculates the yield as a percentage of the treasury bills with a face value of $100.


What Is The TBILLYIELD Function?
The TBILLYIELD function in Excel calculates the yield as a percentage of the treasury bills with a face value of $100.
Treasury bills or just the T-bills make up for a great piece of an asset in our investment portfolio. But, generally, when the government raises money, It can do it in one of two ways:
- Long-term bonds with maturity ranging from 3-30 years comprise a significant constituent of capital markets.
- Short-term bonds with maturity ranging from 30 to 364 days are a part of the money markets.
The treasury bills are sold in denominations of $100 or even $1000 and have a maturity of less than one year.
T- the bill is a money market instrument usually issued at a discount price from its face value and is redeemed at face value after its maturity. For example, if you purchase the T-bill for $960, you will get $1000 at maturity.
The additional $40 you receive is the interest earned on the bills, also called phantom interest, since T-bills do not pay a regular interest payment similar to coupon bonds.
The T-bills can be purchased directly from the TreasuryDirect or the secondary market through the broker application.
If you do buy from the secondary market, there is a chance that the T-bill price might fluctuate due to falling or rising interest rates. This is because interest rates have an inverse effect on debt instruments.
For example, if the treasury bill is issued at $945.23, and the interest rates go up, then the price of the T-bill will further fall since many investors would start buying bonds and paying treasury bills more interest payments.
On the other hand, when the interest rates go down, the price of the T-bill will go up from $945.23, as it becomes more valuable than the bonds or T-bill's subsequent issues.
Based on this understanding of treasury bills, we will see how to use the function to calculate the yield of the speculative T-bills and those present in the portfolio.
-
Treasury bills (T-bills) are short-term bonds with maturities ranging from 30 to 364 days and are part of the money markets. They are sold in denominations of $100 or $1000 and are backed by the full faith and credit of the US government.
-
The TBILLYIELD function in Excel is used to calculate the yield as a percentage of the T-bills based on the settlement date, maturity date, and price of the T-bill.
-
The yield of T-bills is calculated by purchasing them at a discount price and redeeming them at face value upon maturity. The difference between the purchase price and face value represents the interest earned, often referred to as phantom interest.
-
The TBILLYIELD function can be used directly from the function library in Excel or as a worksheet formula. It requires inputting the settlement date, maturity date, and price of the T-bill.
-
When evaluating T-bills in the secondary market, the TBILLYIELD function can help compare the yields of different T-bills to make informed investment decisions. The settlement date is typically T+2 days, and the highest-yielding T-bills can be added to the portfolio.
Understanding The TBILLYIELD function
The function is categorized as a FINANCIAL function that calculates the yield on the treasury bills based on three components - the settlement date, maturity date, and the price of the T-bill.
Suppose you have the T-bill price of $97.36 in your portfolio. You bought the bond instrument from the secondary market on 3rd August 2022.
The settlement date is usually T+2 days for the capital and money market instruments. So the settlement date for the T-bill would be 5th August 2022.
The maturity date for the treasury bill is 18th December 2022. Therefore, based on these three inputs, using the function resulted in 7.23%.
Thus, the government is essentially paying you 7.23% additional income to money for varying periods.
An important thing to remember about Treasury bills or bonds is that they are backed by the full faith and credit of the US Government. Therefore, when you buy corporate bonds, there is a high probability that the company may go bankrupt and be unable to pay off the borrowed amount.
However, the same is not the case with treasury bonds or T-bills.
The syntax for the function is:
=TBILLYIELD(settlement, maturity,pr)
- settlement = (required) settlement date of the T-bill
- maturity = (required) maturity date of the T-bill
- pr = (required) price of the treasury bill
The function calculates the yield for the T-bill in the denomination of $100. If you need to find the net for the bill in the denomination of $1000, divide the T-bill's price by 10 and then calculate the yield using the function.

How to use TBILLYIELD function In Excel?
The function can be used via two different methods. This section will explore both ways to help you decide what works better.
a) Method #1: From the function's library
When you access the function from the library, you get a dialog box where you need to input arguments, and you directly contact the result in the selected cell.
This method can be used by beginners when they have limited knowledge about different functions or what they do.
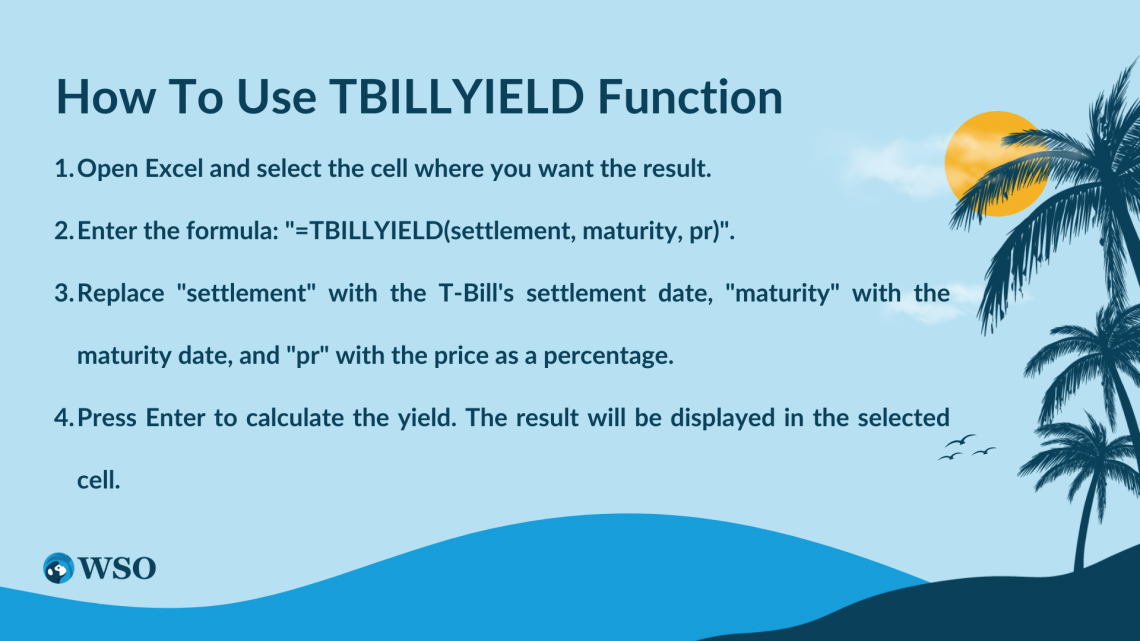
To use the TBILLYIELD function, please follow the steps below:
- First, select the cell in which you need the result.
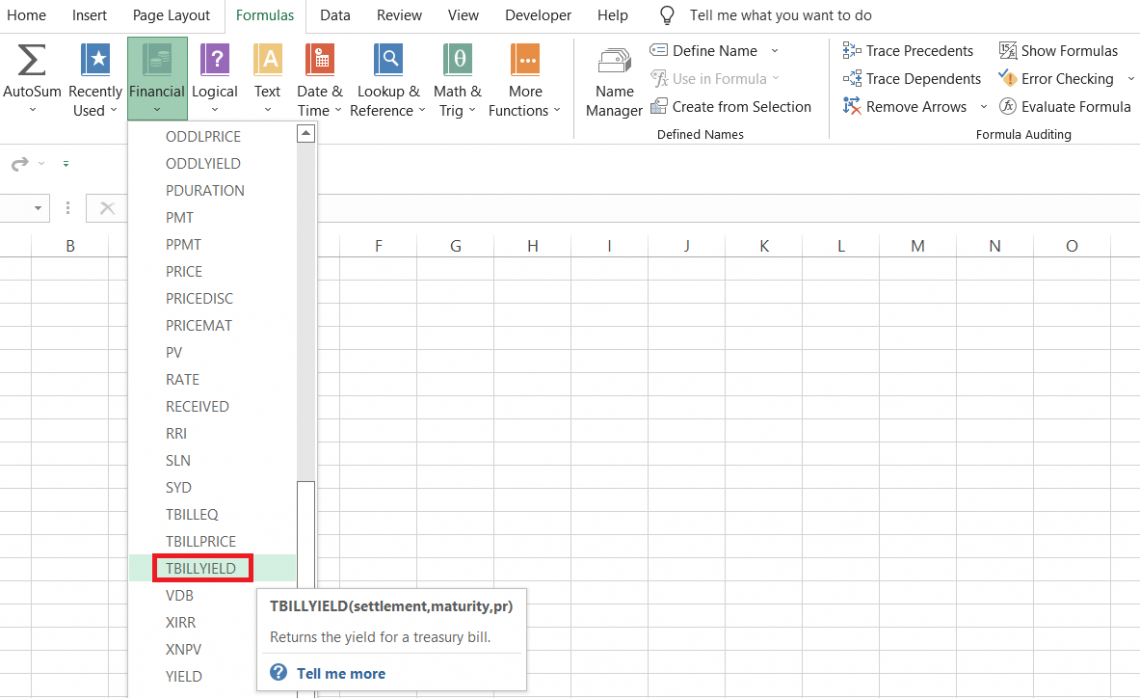
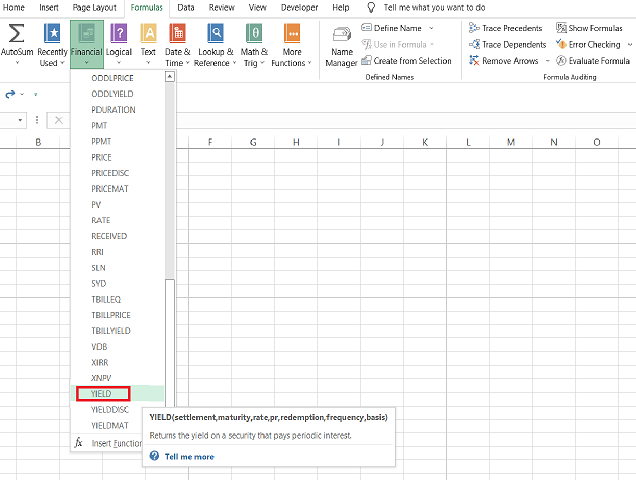
- Next, click Formulas > Financial > select the TBILLYIELD function from the drop-down menu.

- This will open up the dialog box, as illustrated below:
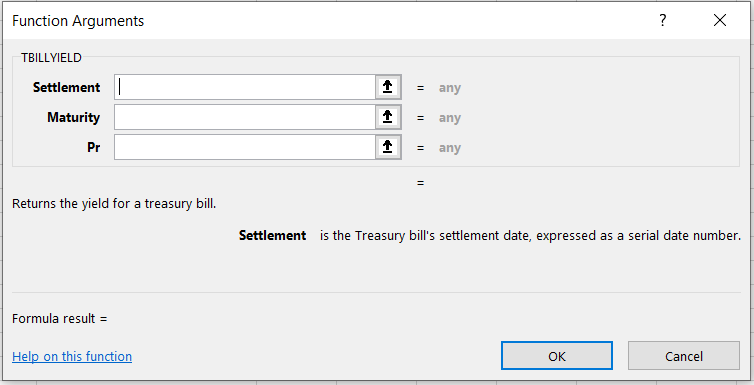
- Next, we input the arguments as per the syntax in the dialog box. The function only accepts the settlement and maturity date as serial numbers, where 44719 is 7th June 2022, and 44890 is 25th November 2022.
If you do not know what the serial number for the dates are, you can directly reference the cells that contain the date value for the respective arguments.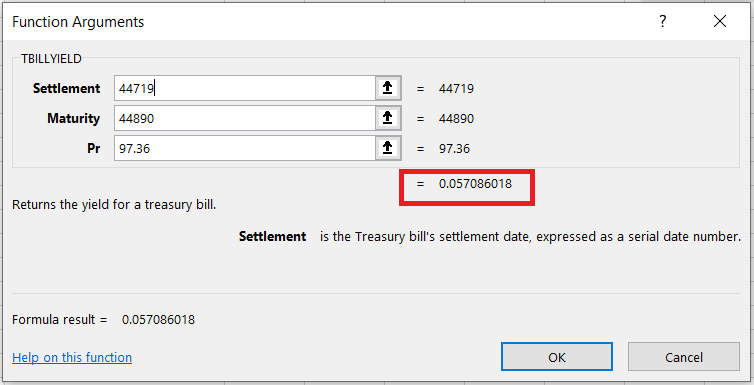
- We get a preview of the result where the yield equals 0.057086018.
- Once you click OK, you will get the same effect in the select cell.
- If required, you can change the outcome into percentage format, which would give you the yield on the T-bill as 5.71%
If you input the dates directly in mm-dd-yyyy format, you will receive an error. Instead, you can reference the cells containing the date to get the result.
b) Method #2: As a worksheet formula
We recommend the more straightforward method to everyone, irrespective of how good they use Excel.
You don't need to worry whether the dates are represented as serial numbers or in MM-DD-YY format. The formula would work and return the yield of the T-bill in the selected cell.
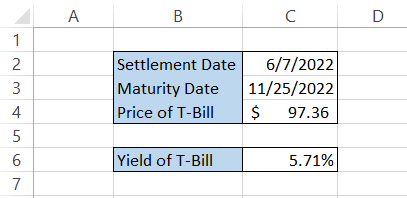
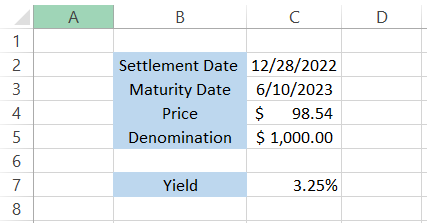
Suppose that you have the data in Excel, as illustrated below:
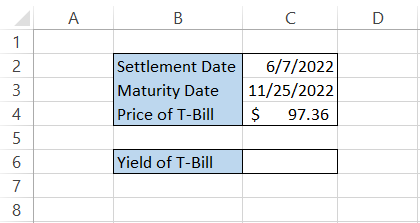
To calculate the yield for the treasury bill, we will use the formula
=TBILLYIELD(C2, C3, C4) in cell C6,
which gives the result as
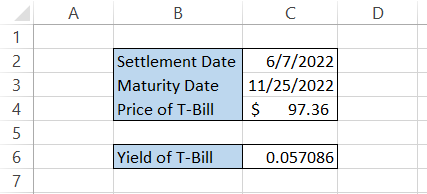
You get the yield of the T-bill as 0.057086. If you need the result in percentage, press the keyboard shortcut of Alt + H + P and Alt + H + 0 (twice), and we get the effect of 5.71%.
TBILLYIELD Function Example
When you buy the T-bill from the primary market after the issuance, the website already displays the yield on the T-bill, so using the function for the same thing does not add much value.
In this section, we will see how you can evaluate different T-bills available in the secondary market and decide what T-bills to add to your portfolio based on the yield they generate.
a) Example #1
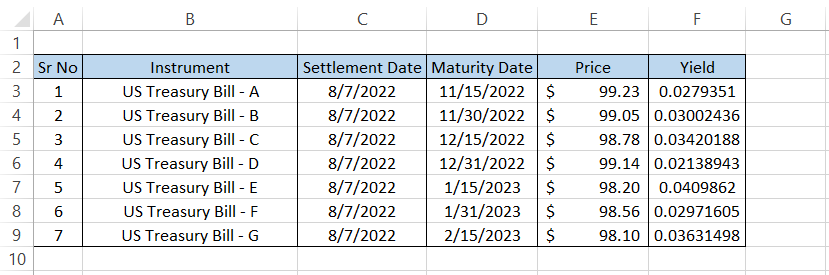
Suppose the date today is 5th August 2022, and you shortlist several T-bills to add to your portfolio. The two T-bills with the highest yield will be added to the portfolio. The data looks as illustrated below:
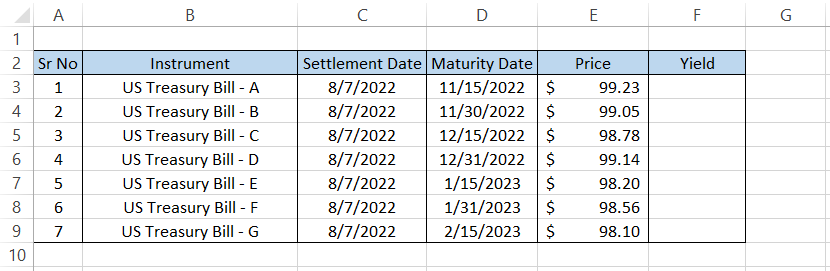
To calculate the yield on the treasury bills, we will use the formula
=TBILLYIELD(C3, D3, E3) in cell F3,
which will give us the result of 0.0279351.
Dragging down the formula to the cell F9, the spreadsheet will look like this:
Again, we will use the keyboard shortcut of Alt + H + P to get the result in percentage and Alt + H + 0(twice) to add digits after the decimal. The final result in the spreadsheet would look like this:
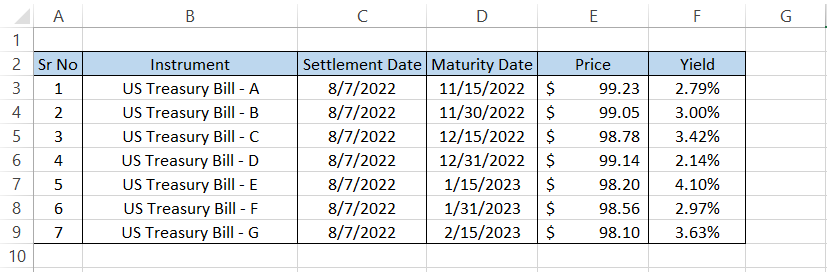
Based on the result, we find that the two highest yields are for the US Treasury Bill - E and US Treasury Bill - F, with 4.10% and 3.63%, respectively.
Both the T-bills can be added to the portfolio today itself, which brings us to the final question - why the settlement date is 7th August 2022?
As we had already mentioned, the analysis date is 5th August, and the T-bills are settled in T+2 days, so the settlement date is equal to 7th August 2022 in the example above.
b) Example #2
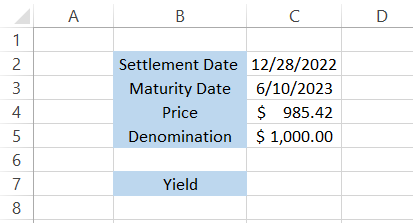
We know that you might have a question - What needs to be done if the bond's denomination exceeds $100?
Let's say you buy a $1000 denomination bond, but the formula only calculates the yield of bonds having a face value of $100.
The data looks as illustrated below:
If you use the formula
=TBILLYIELD(C2, C3, C4),
you get an exciting result of -1.9723619.
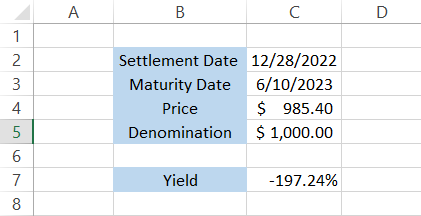
A negative yield means the government is getting paid to borrow money from you as an investor. Therefore, the amount you would get at the maturity of the treasury bill will be less than what you were promised at the time of its purchase.
The negative yields on T-bills are quite an unusual phenomenon. However, it can happen once in a blue moon, usually when the traders buy the T-bills or bonds from the secondary market.
Wait, maybe we lost track of what we were doing. Yes! What to do if you buy T-bills with the more significant denomination, then?
The answer is simple - divide the price of the T-bill the price is by the $100 denomination. For example, the $985.42 is split by 10, so the bond's price becomes $98.542.
This time we get the yield on the bond as 3.25%, which you would earn on the T-bill bought for $985.40.
YIELD vs. TBILLYIELD
YIELD is another function that you might notice in Excel and might have even correctly guessed that it calculates the yield on the debt instruments.
YIELD is categorized as a financial function that calculates the yield on debt instruments, making a coupon payment for the investors.
The syntax for the function is:
=YIELD(settlement,maturity,rate,pr,redemption,frequency,[basis])
where,
- settlement = (required) settlement date of the bond
- maturity = (required) maturity date for the bond
- rate = (required) the interest rate that the bond pays to the investor, also called the coupon rate
- pr = (required) price of the bond
- redemption = (required) redemption value of bond per $100 face value
- frequency = (required) the number of coupon payments each year
- basis = (optional) day count basis, where 0 equals to default value.
Since we already have TBILLYIELD for calculating T-bills, what would happen if we used the YIELD function instead?
Suppose that you have the data as:
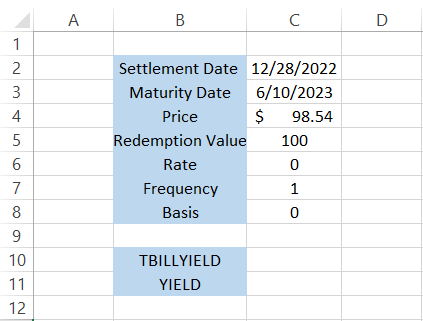
But first, let's understand why we took the above-illustrated data.
- Since T-bills do not pay a coupon payment but instead pay a 'phantom' income to the investor by being issued at a discount and maturing at par value, we have kept the rate equal to zero.
- As the 'phantom' income would be paid only once a year, i.e., at the end of maturity of the T-bill, we have set the frequency as 1.
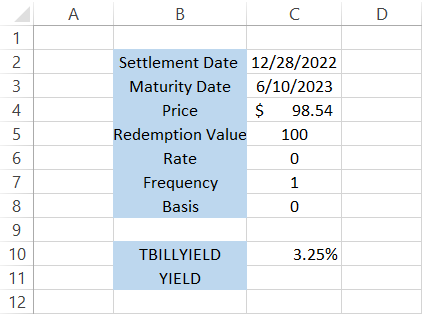
First, we will calculate the yields on T-bill using the formula
=TBILLYIELD(C2, C3, C4,)
which gives us a result of 3.25%.
By using the formula
=YIELD(C2,C3,C6,C4,C5,1),
we get the yield as 3.29%.
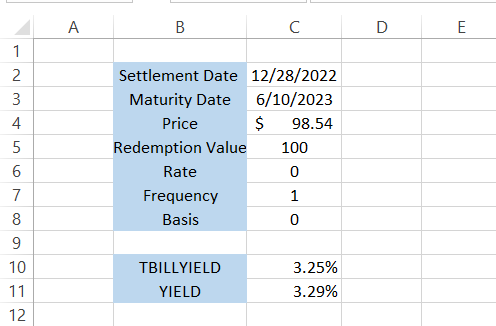
There isn't much deviation in the results. As you can see, there is only a difference of 0.04% in both results.
However, we would still advise you to use the TBILLYIELD function to calculate the treasury bills yield!


or Want to Sign up with your social account?