PEARSON Function
An Excel Statistical function used to calculate the Pearson Correlation Coefficient represented by r.


What is the PEARSON Function?
The Pearson function is an Excel Statistical function used to calculate the Pearson correlation coefficient represented by r. It measures the correlation between two variables defined by continuous data from a random population.
The correlation coefficient is derived from the Pearson correlation test, which determines the direction and strength of the variables. The output is in the range of -1 to 1, indicating the strength of the association.
- The PEARSON function is used to determine the strength and direction of the linear relationship between two variables. It returns a value between -1 and 1, indicating the degree of correlation.
- The PEARSON function calculates the correlation coefficient, which indicates how changes in one variable are associated with changes in another variable.
- A value of 1 indicates a perfect positive linear correlation, -1 indicates a perfect negative linear correlation, and 0 indicates no linear correlation.
- The PEARSON function only measures linear correlation. It does not account for non-linear relationships between variables.
What is the Pearson correlation test?
It determines the direction and strength of two variables and gives the output as a Pearson correlation coefficient. If the value of r is -1, it represents a perfect negative correlation, while a value of +1 represents a perfect positive correlation.

If the value is zero, there is no association between the two variables.
In practice, it is not easy to see a perfect correlation, i.e., get the r value as either -1 or +1.
When you calculate the value, the result you will usually get is the decimal value between the upper and lower limit of the coefficient (i.e., it will always range from -1 to 1).
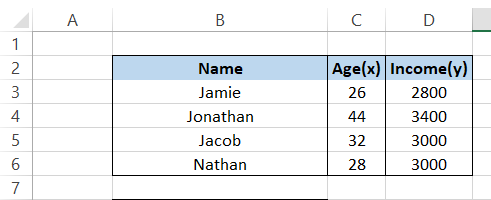
To understand it better, let’s look at an example of a correlation test. Assume four people from a random population have age(x) and income(y) as two different variables. The table looks as below:
| Name | Age(x) | Income(y) |
|---|---|---|
| Jamie | 26 | 2800 |
| Jonathan | 44 | 3400 |
| Jacob | 32 | 3000 |
| Nathan | 28 | 3000 |
By representing their age on the X-axis and income on the Y-axis, our scatter plot will look as follows:
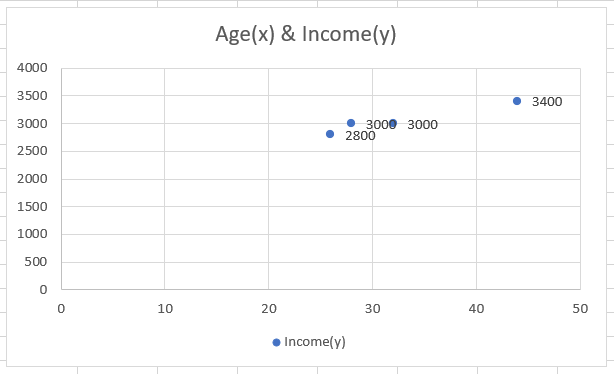
As you can see, our scatter plot is almost linear (linear means a straight line can be drawn through it). So if we draw a straight line through the data, the linear relationship between the data will look as:
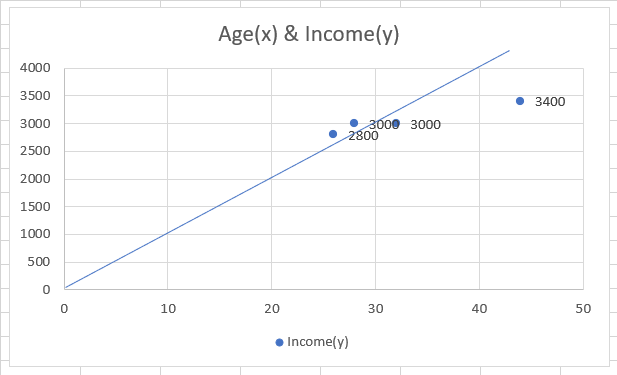
This linear relationship is known as the correlation between the variables.

Pearson Correlation Coefficient (r)
One of the outputs returned by performing the correlation test is the correlation coefficient (r). The value of r signifies two essential traits of the correlation:
- The direction of the correlation
- Strength of the correlation
For our data of four people from a random population having age (x) and income (y) as two different variables, the correlation coefficient (r) is 0.969. Since the value of r is positive and close to +1, it defines a positive correlation between the two variables.
If the value of r was negative and towards -1, it defines a negative correlation between the two variables. But that concludes the direction factor of the correlation of the variables.
What about strength? The closer the value of r to either -1 or +1, the stronger the correlation between the values. On the other hand, the closer to 0, the value of r, the lower the correlation.
Assume that our data consist of the same age but different income values as below:
| Name | Age(x) | Income(y) |
|---|---|---|
| Jamie | 26 | 1800 |
| Jonathan | 44 | 1200 |
| Jacob | 32 | 1500 |
| Nathan | 28 | 1700 |
The scatter plot for the data would look as below:
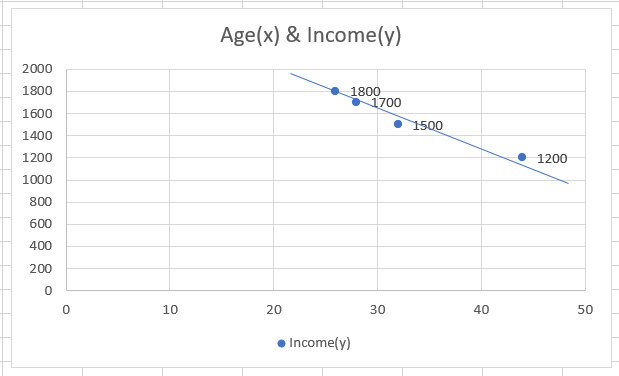
Do you notice a linear relationship between the data but is in a downward direction?
This represents the negative correlation between the two variables, i.e., the value of the correlation coefficient is inclined towards -1. When we calculate the value of r for this data, we get the result of -0.984.
Note
The closer the data points are toward the linear relationship, the stronger the correlation between the two values.
As we have represented how the negative and positive correlation looks on a scatter plot, it’s only fair we show what the scatter plot should look like when the correlation coefficient value is near 0.
Assume the data below with different income values:
| Name | Age(x) | Income(y) |
|---|---|---|
| Jamie | 26 | 3500 |
| Jonathan | 44 | 2000 |
| Jacob | 32 | 2500 |
| Nathan | 28 | 500 |
The scatter plot for the data would look as below:
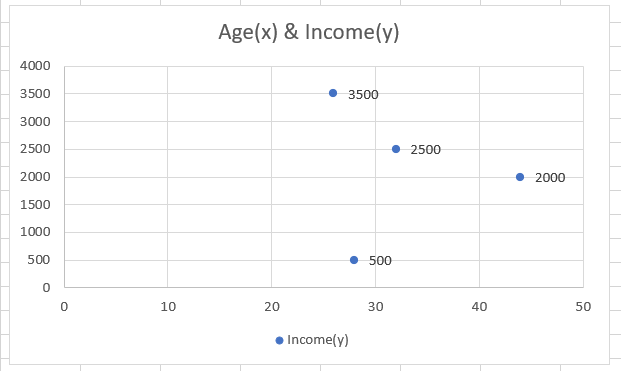
The data shows no linearity (we can't draw a straight line through all the points) and is random in all likelihood. When we calculate the data's correlation coefficient (r), we get the result of -0.107. The value of r does not have any units.
Getting the coefficient values as -1, +1, or 0 is practically difficult. However, as the values returned are in decimals, you can interpret them by applying specific cutoffs to the values to describe the strength of the correlation coefficients(r).
For example, if the value falls between 0.00 - and 0.10, it represents no correlation, while a value between 0.90-1.00 indicates a powerful correlation between the variables.
PEARSON Function formula
The correlation coefficient (r) is calculated between two variables that are represented by continuous data from a random population using the formula:
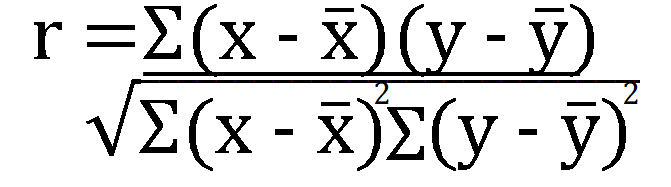
![]()
Let's manually calculate the correlation coefficient to understand how this formula makes life better for analysts by saving time. Let's assume our data of four random people for their age and income.
| Name | Age(x) | Income(y) |
|---|---|---|
| Jamie | 26 | 2800 |
| Jonathan | 44 | 3400 |
| Jacob | 32 | 3000 |
| Nathan | 28 | 3000 |
We have separated all the values from the formula and will build upon them as we calculate the coefficient value.
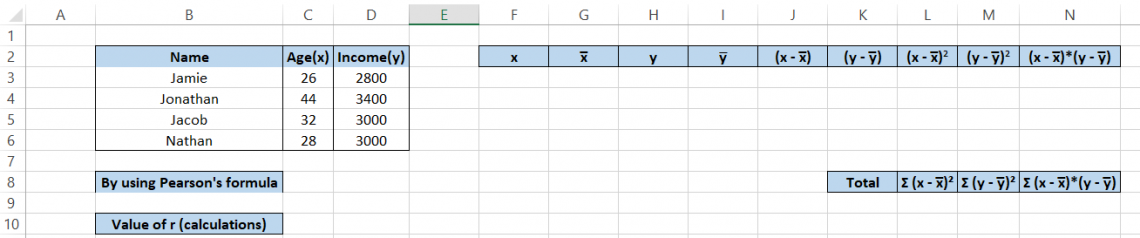
The steps to follow are:
- Copy the values for Age and Income in the F and H columns, respectively. You can also reference them using the equal ( =) sign.
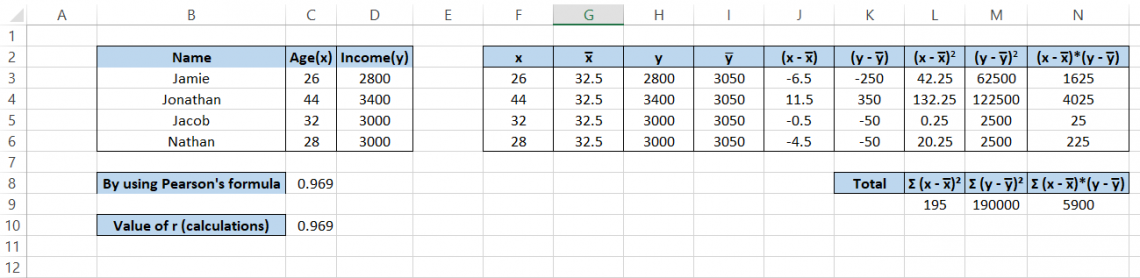
- Calculate the mean for Age and Income using the AVERAGE function such that the average age is 32.5 and the average income is 3050
- Subtract the value of x from its mean x as well as y from its mean y in columns J & K, respectively
- For columns L & M, take the square of the values in columns J and K, respectively, using the formula =POWER(J3,2)
- Multiply the values in columns J & K to get the result in column N
- In cell L9, take the sum of all the values in column L using the formula =SUM(L3:L6)
- Similarly, in cells M9 and N9, take the sum of the values in the M & N columns, respectively.
- Finally, in cell C10, use the formula =N9/(SQRT(L9*M9)) to get the result for Pearson’s correlation coefficient, which results in 0.969.
The syntax for the function is:
=PEARSON(array1, array2)
Where,
- array1 = collection/set of independent values
- array2 = collection/set of dependent values
Note
When logical or text values are supplied as a part of the array, they are ignored by the function. If the lengths of array1 and array2 are different, you may get an #N/A error.
How to use PEARSON Function in Excel?
Here comes the most awaited moment. Finally, we will use the Excel spreadsheet formula to calculate the value of r. Our data for age and income is as below:
Using the formula = PEARSON(C3:C6, D3:D6), we get the result of 0.969, the same as what we had calculated manually in our Excel spreadsheet. Yep, it's that simple.
But by now, you know the absolute basics of a correlation test and what we intend to achieve by calculating the correlation coefficient r.
So now, even if you don't have access to your laptop, you can still grab a piece of paper and pen along with the calculator and get the same value to better understand different metrics of financial statements.
Let's see another example of calculating the value of r using the formula in Excel.
Assume that you prepare the three-statement model for Nike Inc. for the financial year-end of 2019.
In column C, you have historical and predicted 'Revenue,' while in column D, you have the expected 'Earnings per share.'
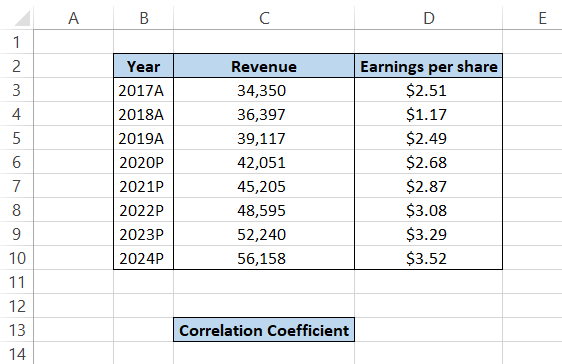
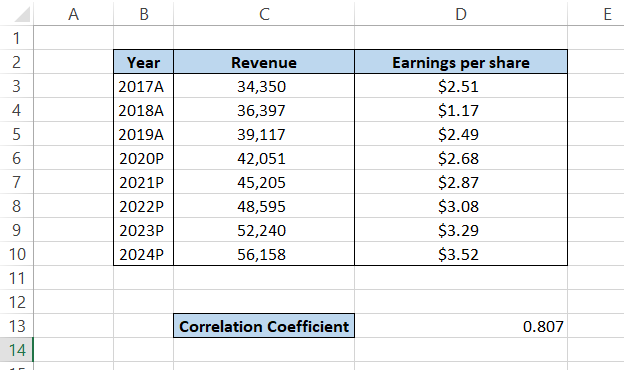
By using the formula = PEARSON(C3:C10, D3:D10) in cell D13, you will get the result of 0.807. This implies that the Revenue and Earnings per share have a linear relationship and a strong positive correlation.
There aren't any 'outlier' predictions or a sudden spike in either revenue or EPS (for example 100% increase in revenue in 2023 followed by a -10% decrease in revenue in 2024).
If the prediction has outlier values, the Pearson correlation coefficient deviates toward zero.
If you get recurring digits or a large decimal number after using the formula, you can use the ROUND function along with the formula such that =ROUND(PEARSON(C3:C10, D3:D10), 3).
The digit 3 means that we have rounded our value to three digits after the decimal point.
PEARSON vs. CORREL Function
The CORREL function is similar to the PEARSON function in calculating the correlation coefficient r for two values from random populations.
However, the only advantage that the CORREL function 'held' was that it gave more accurate values than the PEARSON function in Excel versions before 2003 (perhaps because hardly anyone uses them nowadays).
Since then, Excel has flourished tremendously as software. If you use either function to calculate the value of r, you will get the same result (without any rounding-off errors for either function).
The syntax for the CORREL function is
=CORREL(array1, array2)
Where,
- array1 = collection/set of independent values
- array2 = collection/set of dependent values
Note
When logical or text values are supplied as a part of the array, they are ignored by the function. If the lengths of array1 and array2 are different, you may get an #N/A error.
For example, assume that you have the below data for x & y:
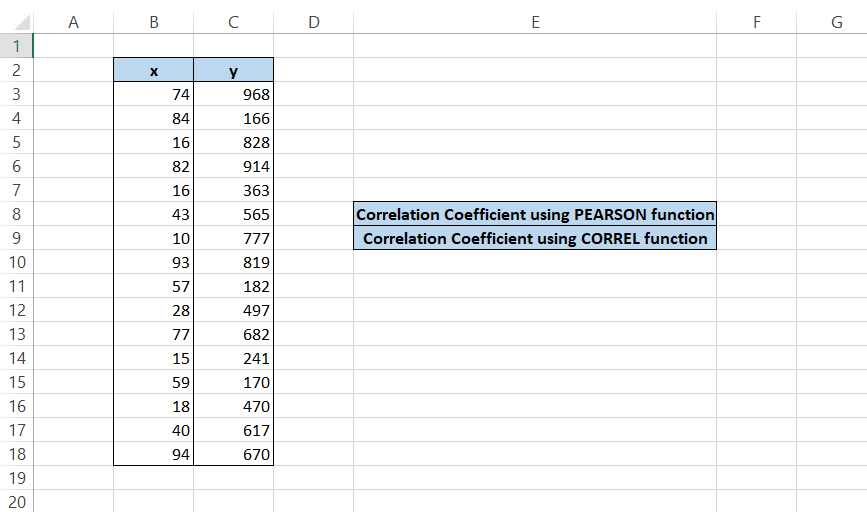
We use the formula =PEARSON(B3:B18, C3:C18) in cell F8 and =CORREL(B3:B18, C3:C18) in cell F9 to get the result of 0.195788 for both the formulas.
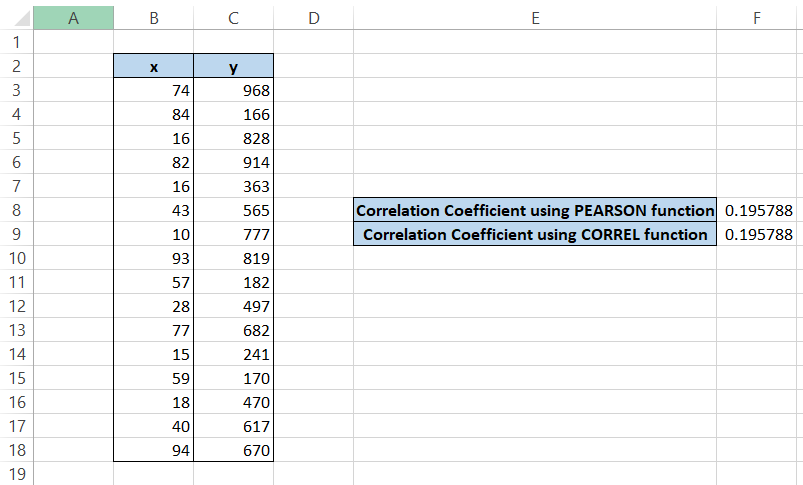
It is ultimately your preference what function you use to find the value of correlation coefficient r, as both give the same result.
Things to remember about the PEARSON Function
You should keep some pointers when using this function:
- If you reference arrays of different lengths, say C3:C6 as array1 and D3:D7 as array2, you will get an #N/A error since array2 has one element more than array1.
- You might get a #DIV/0! Error if any reference arrays (array1 or array2) are empty or have a value of zero.
Free Resources
To continue learning and advancing your career, check out these additional helpful WSO resources:


or Want to Sign up with your social account?