PRICE Function
A financial function in Excel that returns the bond price per $100 of face value


What is the PRICE Function?
The PRICE function in Excel returns the bond price per $100 of face value, assuming that the interest payments are made periodically.
The general definition of price is the amount that needs to be paid in exchange for something. That ‘something’ in our case is the bonds, and the function calculates the cost for those bonds per $100 of face value (essentially, assuming a $100 face value).
You may be wondering - Why does the function only calculate the cost of bonds with a face value of $100?
Generally, bonds are issued at a par value of either $1000 or $100. These are the most common denominations that you would find in the bond market. Microsoft utilized this information and created a function that would let you calculate the bond price.
As an investor or financial analyst, you can use the function in Excel to determine the cost of a bond and find the security that best suits your portfolio.
This article will guide you on how to use the function and make sound investment decisions.
- PRICE calculates the cost of a bond per $100 face value based on inputs like settlement date, maturity, coupon rate, yield, and frequency.
- It is used to value bonds for investment decisions and determine if quoted bond prices are accurate.
- The settlement date is typically 2 days after purchase, maturity is the expiry date, and rate is the annual coupon rate.
- Yield refers to the bond's expected return from coupon payments. Frequency is the number of payments per year.
- PRICE allows modeling bond prices based on changing inputs and can validate prices from other sources.
Understanding PRICE function In Excel?
This function is categorized as a financial function. It calculates the cost of a bond per $100 of face value. The only requirement is that the bond pays interest periodically.
Generally, bonds are initially issued at a par value of $100. When they start trading on the secondary markets, they may face a lot of fluctuations in cost, mainly due to interest rate changes and any major socio-economic events.
Bonds have an inverse relationship with the federal funds rate. This means that when the interest rates are hiked, the bond cost decreases, meaning it is a less desired asset.
Since newer bonds offer higher interest rates, older bonds, with lower coupon payments, start trading at a discount.
On the other hand, when interest rates fall, the cost of acquiring older bonds rises since they offer larger coupon payments as compared to the newer bonds in the market. Hence, the older bonds are said to be trading at a premium when interest rates plunge.
For example, if the bond is issued at $100 and is trading at $108, then the bond is said to be trading at a premium. Similarly, if the cost is below the par value, for example, $92, then the bond is said to be trading at a discount.
As a prospective buyer of the bond, you can use the function to compare two different options and choose what makes better security for your portfolio.
PRICE Function Formula
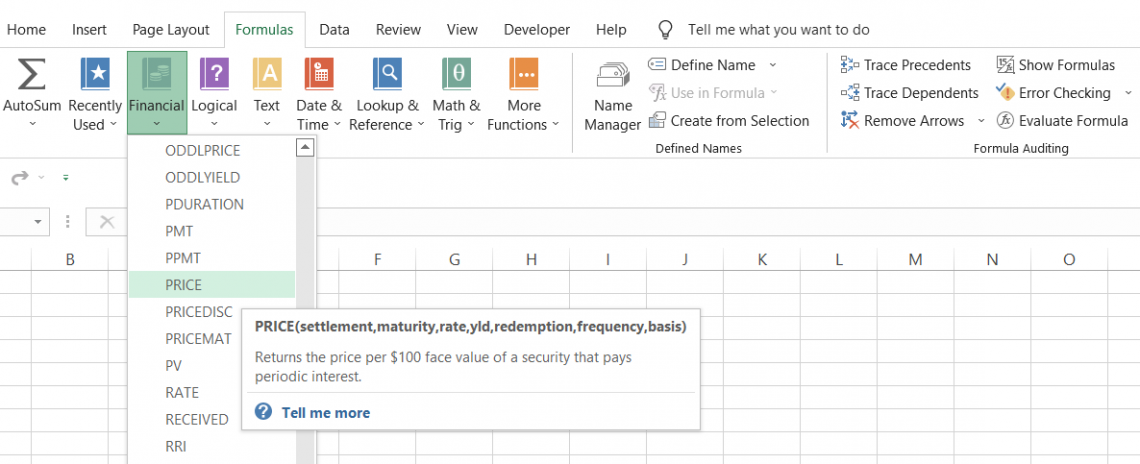
The syntax for the function is:
=PRICE(settlement, maturity, rate, yld, redemption, frequency, [basis])
where,
- settlement = (required) The settlement date for the bond (usually two days after the date the bonds are purchased)
- maturity = (required) The maturity date for the bond, or the date when the bond expires
- rate = (required) The annual coupon rate for the bond
- yld = (required) The annual yield, or the returns earned by investors annually, from the bond’s coupon payment
- redemption = (required) The redemption value of the bond per $100 of the face value
- frequency = (required) The number of times the coupon payments are made each year.
- basis = (optional) The financial day counting basis used for the bond. It can take different values, as illustrated below:
| Basis Value | Day Count Basis |
|---|---|
| 0 / Default | US (NASD) 30/360 |
| 1 | Actual/Actual |
| 2 | Actual / 360 |
| 3 | Actual / 365 |
| 4 | European 30/360 |
How to use the PRICE function
The function can be a bit tricky to understand, considering there are various arguments that you need to look at. However, once you get the hang of it, you can easily use the function to calculate the bond cost.
Assume that you have the data in Excel illustrated below:
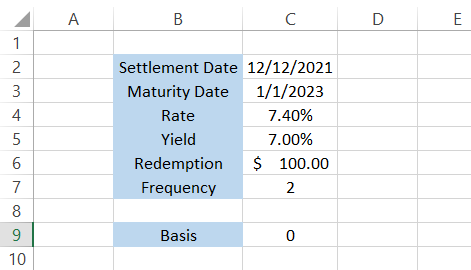
Step #1: Settlement
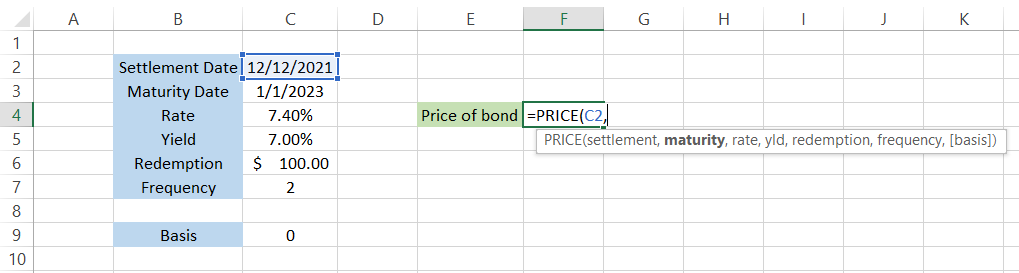
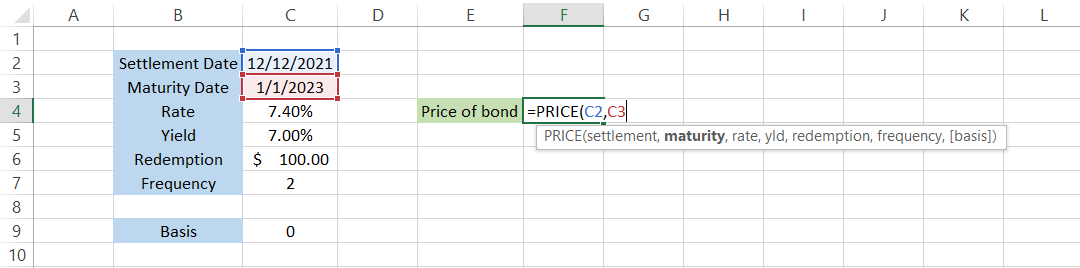
We will begin with the equal sign (=) and type in the function name. Next, reference our first argument, which is the settlement date. Basically, the settlement date is the day on which the ownership of the bond or security is transferred to you.
The settlement date for securities is generally T + 2 days, meaning that if you bought the securities on Monday, the ownership is transferred to you by Wednesday.
The formula in Excel will be =PRICE(C2,maturity,rate,yld,redemption,frequency,[basis]).
Step #2: Maturity
The next argument in our formula is the maturity date for the bond. As an investor, there is a credit risk (meaning the borrower might fail to repay your loan) when you invest in bonds.
You would expect your principal amount back after a certain period of time, unless you invested in perpetual bonds.
On the maturity date of the bond, you receive the entire principal amount, along with any accrued interest. In this case, our maturity date is in cell C3 so our formula in Excel will be = PRICE(C2,C3,rate,yld,redemption,frequency,[basis]).
It is recommended to use the DATE function to input either the settlement or maturity date in Excel. For example, if you need to input 31st March 2022, the formula will be =DATE(2022,3,31). As a result, the chance of running into a #VALUE! Error will be minimized substantially.
Step #3: Rate
The rate is the annual coupon rate, or the interest rate, that the bond is paying to its investor. Assume that, if the interest rate is 7% and the cost of the bond is $100, then the annual coupon payment made to you will be $7.
By referencing the value of cell C4, we will get the formula as =PRICE(C2,C3,C4,yld,redemption,frequency,[basis])

Step #4: Yld
Yield refers to the returns that the investor will earn from the annual coupon payments. The easiest way to calculate yield is to divide the coupon amount by the cost of the bond.
If the bond is currently trading at $93 and pays a coupon of 7% ($7 on a face value of $100), then the yield is equal to 7.52% ($7 / $93). Of course, if the cost of the bond changes, so will the yield on the secondary market.
The formula after referencing cell C5 becomes =PRICE(C2,C3,C4,C5,redemption,frequency,[basis])
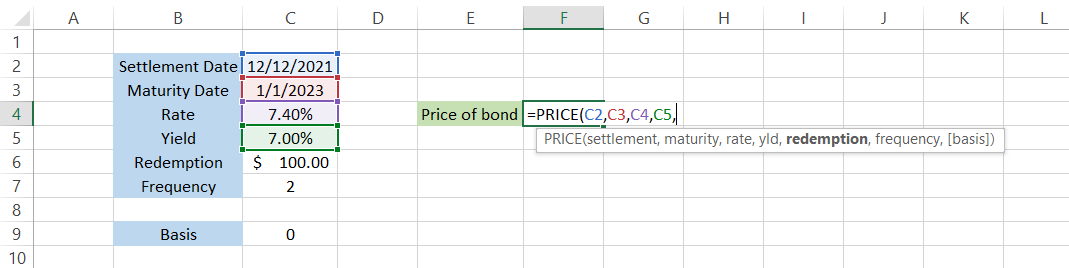
Step #5: Redemption
The redemption value is the rate that will be paid back to the investor if the bond is repurchased by the issuer on or before the maturity date.
The redemption value in our spreadsheet is equal to $100 which, if referenced in our formula, changes the formula to =PRICE(C2,C3,C4,C5,C6,frequency,[basis]).
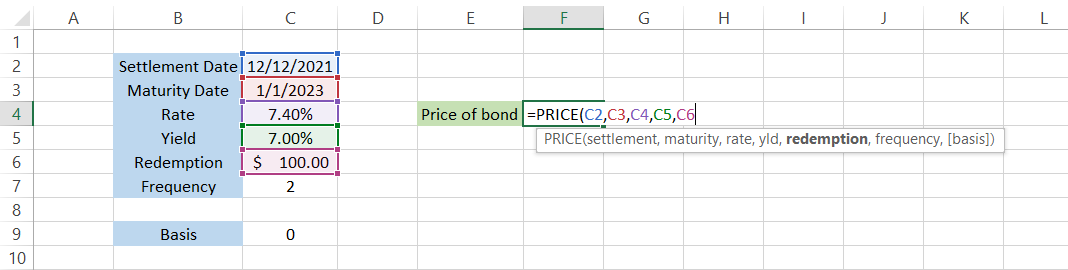
Step #6: Frequency
The final piece of the puzzle (required arguments) is the frequency of the coupon payments for the bond. Some bonds may pay interest semi-annually, some may pay quarterly, while some might pay annually.
Since the bond in our example pays a semi-annual coupon payment, the frequency is equal to 2.
Now, all our required arguments are fulfilled, and we can use the parenthesis to close the formula and press enter to get the result:
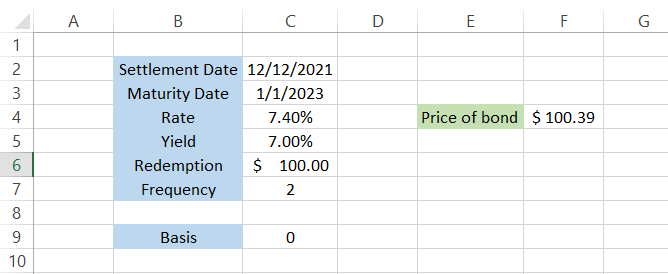
Based on our inputs, the cost of our bond should be equal to $100.39. We have actually excluded the basis argument, meaning Excel assumed a value of zero.
Step #7: Basis (optional)
The ‘optional’ argument basis is used to input the day count convention, which is a system to determine standardized calculations for interest or coupon payments for a bond.
Based on what convention you use for the calculations, the value can range from 0-4, which will ultimately give you a varied result.

PRICE Function Example
Assume that you are looking to invest in a 30-year treasury bond. Let’s say you’re looking at buying the bond on 1st March 2022, and it has a maturity date of 1st March 2052.
The yield for the bond is 2.63%, while the rate is equal to 3.23%, paying a semi-annual coupon payment. The data is illustrated in the spreadsheet below:
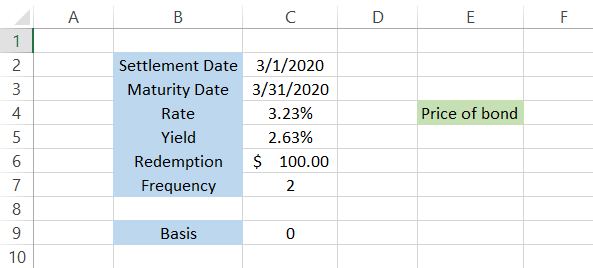
By using the formula =PRICE(C2,C3,C4,C5,C6,C7,C9), we will get the estimated cost of the bond as $84.88. This is ALMOST exactly equal to what Bloomberg is quoting on their website.
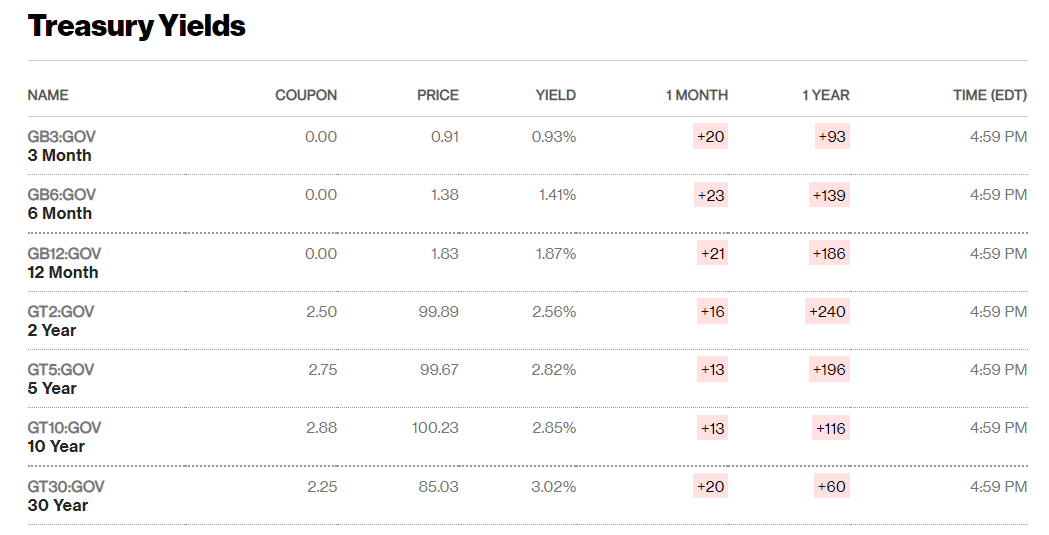
The minute difference in cost ($84.88 vs. $85.03) can be attributed to the different yields and rates the bonds offer.
Nonetheless, the function accomplishes our objective of finding the bond price based on the various inputs that you provide in Excel.
Let us take a look at a practical example: If you are working in an asset management company, it is very likely you see all of these arguments on a daily basis.
We can probably bet you know, by heart, in which column you would find the maturity date for the security and which column represents the rate for the bond.
Sometimes, you might need to determine whether the comparative costs for the bond are correct as a part of due diligence. Why? Because we have been overly dependent on machines, which tend to make honest mistakes now and then.
The logic for the automated process could be glitching (or maybe you input a faulty formula), which is not a good thing considering millions of dollars are invested in these securities.
Assume that you have the data in Excel illustrated below:
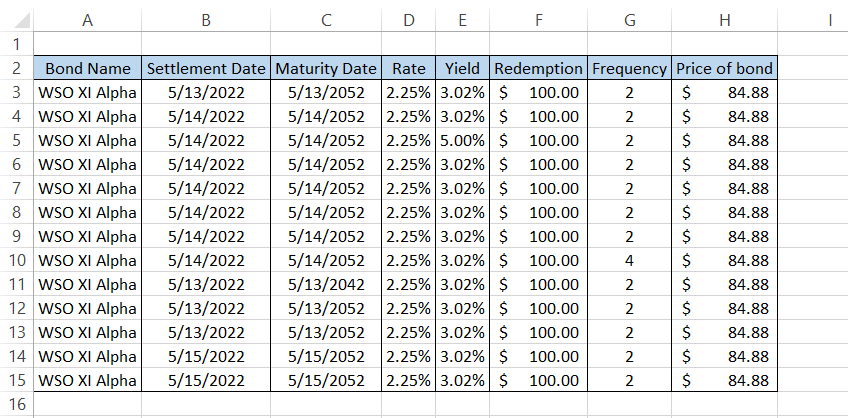
Before uploading the information to your internal systems, you decide to check whether the bond price is correctly reflected in the spreadsheet.
You add another column, I, and compare the bond price using the formula =PRICE(B3,C3,D3,E3,F3,G3,0). You will get the following result:
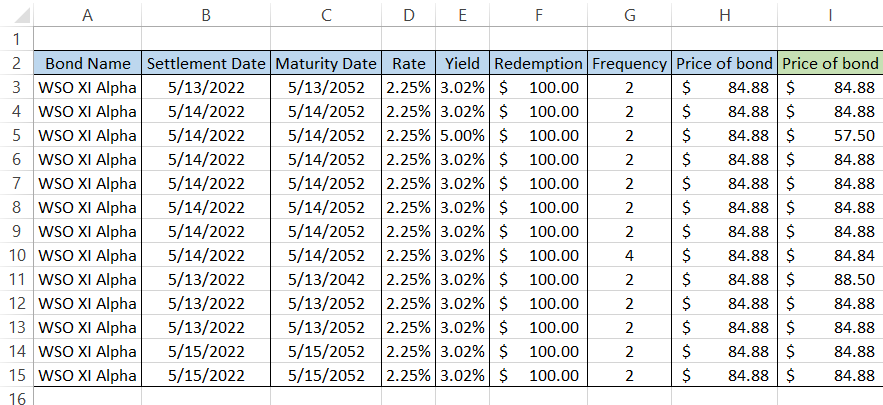
Further, cell-to-cell comparisons between columns H and I let us know that the rate for the three bonds does not match each other.

On closer inspection, we see that, sometimes, either the yield or rate is misrepresented, while, for row 10, the frequency is equal to 4 (quarterly coupon payments).
As a result, the cost of the bond derived from the formula is completely different from what was received using the automated process. The function works wonders, right?


or Want to Sign up with your social account?