Financial Modeling Training & Certification Programs
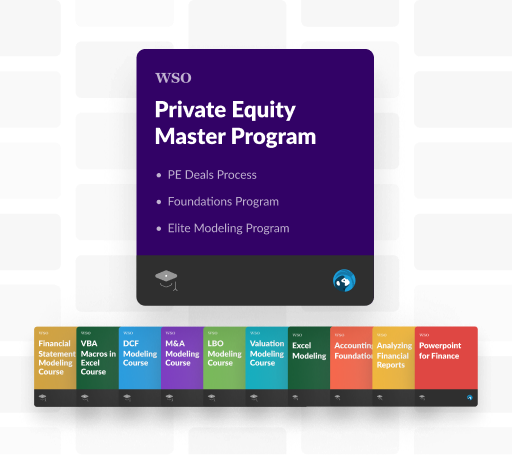
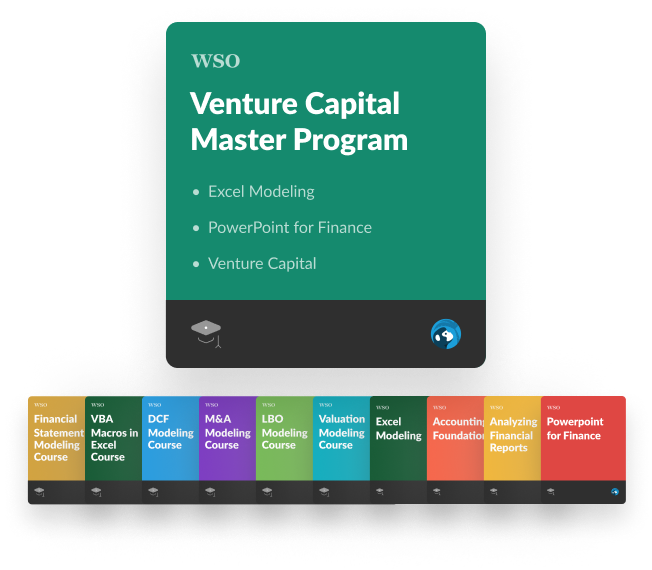
These financial modeling and valuation programs are a great way to get access to our most popular training in a heavily discounted bundle to help you accelerate your finance career. Each course is taught by a team of elite finance professionals with actual deal experience from the top firms in the world to bring you realistic case studies. WSO's financial and valuation modeling training program includes the most engaging self-paced online finance courses in the world. You will be drawn in and truly retain the information through our rich case studies, quizzes, and gamification, as well as have lifetime access to useful templates for the sector you pick.
The WSO Foundations Program should be used for beginners or those looking to focus more on productivity in Excel and PPT, while the Elite Modeling Program is better suited to more advanced users looking to become expert financial modelers.

Interview Prep Programs
Get an unfair advantage in your investment banking, private equity, hedge fund and management consulting case interviews. WSO offers interview courses with hundreds of detailed sample answers to all of the most common questions, but this is just scratching the surface of these interview packages...you also get:
- Access 30,323 interview questions across thousands of firms (investment banks, private equity & hedge funds and consulting firms)
- Access realistic templates and countless actual modeling tests used in Superdays and the private equity interview process
- Networking course included in all interview packages with detailed templates to help you in your cold e-mail outreach and info sessions

Student Reviews
Wall Street Oasis has trained over 63,000 students at elite corporate and educational institutions for over a decade.
Enrolling in the WSO courses has been one of the best career decisions I’ve made. Whether you're targeting investment banking, private equity, hedge funds, or corporate finance roles, the content is incredibly relevant, structured, and actionable.
The Financial Statement Modeling and DCF Modeling courses taught me how to build clean, audit-ready models from scratch — something I now use confidently in interviews and real-world case studies. The LBO and M&A modules go beyond theory and give you practical insights that even top-tier MBA programs often skip. What really sets WSO apart is how the material is designed by actual Wall Street professionals with bulge bracket and elite boutique backgrounds.
The hands-on exercises, real-world case studies, and downloadable resources make learning seamless, and I especially appreciated the VBA Macros module — it helped me automate tedious Excel tasks and boosted my productivity.
If you're looking to break into or advance in high finance, WSO is not just a course platform — it's a competitive edge. I can confidently say I walked away with technical mastery, sharper problem-solving skills, and a professional toolkit I can leverage throughout my career.
Thank you, WSO, for creating such an impactful and industry-relevant learning experience!
— Gaurav Sahu, MBA Finance Candidate & Aspiring Investment Professional
The exercises were like any other course I had taken. They were making me think and truly…
The exercises were like any other course I had taken. They were making me think and truly focused to test the understanding of the individual.
Really learnt a lot from Excel shortcuts and model building perspectives.
It was indeed an enjoyable learning experience.
I'm an Econ major student, so I've never been taught how to properly do a model, and WSO's modeling course not only prepped me for modeling but also taught me a lot of tips and tricks that have saved me so much time while building up models. Also, it helped me to ace all my technical interviews.
For those who thinking about getting this course, do it now! You won't regret!
I am not sure how it compares to other LBO courses in terms of value for money (if there are even other LBO online courses out there), but I do want to emphasize that it is an extremely dense course compared to most other online/MOOC courses so the price (probably) scales accordingly compared to standard online course prices from other services.
I've been hailed by my boss and colleagues at work, trident insurance co.ltd finance department,I used the knowledge also in PowerPoint and word ,these hotkeys apply almost in ppt,word and excel. I've been so efficient yet I'm still in campus.
A local leather turning firm also gave me a role in finance and accounting and it's been a lovely experience, I've actually recoup the money I paid wall street oasis for the course and in fact I got a massive discount, Patrick didn't sell it to me$497 dollars if I remember. The PowerPoint course could improved though,it only gives tricks but does not teach one how to actually create a full presentation or pitchbook. I'm sorry that I have to write my review away from home, I saw the email from Patrick and had planned to do this at home unfortunately my schedule with university,exams have Started and work reasons left me with no time,so seeing the second email I had to pull over and give at least something back by the roadside. If one is keen on a career in finance WSO is the place, it's worth it and the discussion section will broaden your commercial awareness. Thank you WSO.
Finally you'll get to the modeling, and you'll cover that in reasonable depth to understand what you're doing.
The course is well laid out with exams at the end of every module. The files you keep from this are a great future reference if you ever forget how exactly to do something. One last thing that I found excellent: the instructor is not just an Excel instructor, but also clearly works in finance. This shows up in additional tips throughout the course on best practices and how best to present your models.
The theory explanation is straight to the point and clear. I could understand all the concepts to build a complex financial modeling.
Currently I'm working at a M&A company in Brazil, and what I've learnt in this course is very useful for my daily tasks.
I do recommend this course.
The teacher explain complex topics in a simple way.
The teacher explain complex topics in a simple way.
There are questions at the end of each section that could be improved upon, but it's a modeling course not exam prep so it is understanable.
Overall, I would recommend this course to someone interested in learning LBOs.
Also, a great bonus with this course is that they provide a lot of exercise problems to work through.
When I first took this course, it did not have as many lessons as it currently does -- so, in fact, it actually covers a little more than what I had gone through in my accounting class. The additional topics are more focused for finance interview questions and finance-oriented careers. I do not think most other courses cover these additional topics, not as far as I have seen. For those who have already completed similar coursework, perhaps this course may still be of value to you.
And to end, I will say this course's pricing is pretty competitive to the standard price of online courses out there through other MOOC services.
The only complaint I have is that the quizzes sometimes have ambiguous questions/answers and the function to show correct answers wasn't working prope…
The only complaint I have is that the quizzes sometimes have ambiguous questions/answers and the function to show correct answers wasn't working properly at the time.
I've done Excel courses before like this but with no practice, so only little of what I learned actually stuck. Practice makes perfect so I'm gonna head back to that :D
A solid use of time and great value for money - especially if purchased within the bundles.
However, despite this being of second nature to me, I decided to check out the WSO financial statement modeling course as part of the Elite Modeling package while planning my move to investment advisory. Needless to say, like the other WSO courses, this was a well-planned out course from which even a seasoned professional like me could take away a lot. Knowing various standards that are used in the finance and investment community helps to blend in with the pros.
Would definitely recommend getting not just this but the whole elite modeling package if that's still on offer. Thanks WSO team! :)
Received this as part of a bundle (fantastic value, I might add), and this was the perfect walk through for someone that knows theoretically what an LBO is, but wants a nuts and bolts perspective. Very accessible and quickly brings you up to speed. A very high yield course.
WSO Affiliate Program
To earn commissions for referrals to our best-in-class online courses and live bootcamps, please fill out an application to join our WSO Affiliate Program

or Want to Sign up with your social account?