Net Asset Value
NAV is the net value of an investment fund’s assets less its liabilities


What is Net Asset Value (NAV)?
Net asset value is the net value of an investment fund, which is the assets minus liabilities. It’s most commonly used in the context of mutual funds or exchange-traded funds (ETF).
Mutual funds and Unit Investment Trusts must calculate their NAV at least once every business day.
Most NAVs represent on a per-share basis, especially in the context of mutual funds or ETFs.
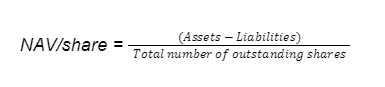
NAV is calculated every day. It uses the closing market prices of the securities in the portfolio at the end of trading.
- NAV is the net value of an investment fund’s assets less its liabilities
- Open funds are like ETFs, publicly traded, predetermined share issuance, and share price can deviate from NAV/share.
- Closed funds are like mutual funds. They are traded privately. They can issue unlimited shares. The share price is equal to the net asset value per share.
- NAV alone offers no insight into how “good” or “bad” the fund is.
- NAV should be looked at over a timeframe to see the historical annual performance.
Analyzing NAV
The NAV represents the fund’s market value. When expressed as a per-share value, it represents the market per unit value, at least for mutual funds.
- If the underlying stocks and bonds inside the fund increase, the NAV of the fund increases.
- If the underlying stocks and bonds inside the fund decrease, the NAV of the fund decreases.
Regardless of what industry, vertical, or sponsor, NAV by itself does not give insights into its performance.
For example,
- The price of an apple is $2 per pound
- The price of an orange is $1 per pound
This information does not indicate whether the apples or oranges are traded at a premium or discount compared to their peers in similar markets. Without context, these prices are merely numerical values and do not reflect any valuation or financial assessment.
Mutual funds and NAV
Investors pool money into a mutual fund, which is used to purchase stocks, bonds, and money market instruments.
Investors receive a set number of shares based on how much they invest. NAV determines the price of each share.
Stocks, bonds, ETFs, and other publicly traded securities on the exchange update their price by the millisecond. Mutual fund managers report the closing price once a day, unlike public securities that may have more frequent updates.
The closing price should include added assets and subtract extra liabilities. It should also consider the number of outstanding shares.
NAV doesn’t represent fund performance in itself, largely because once the mutual fund distributes all the income and releases capital gains to fund shareholders, the NAV becomes meaningless.
Most people evaluate mutual funds to look at its returns, including dividend payments and the underlying securities.
Relevance of NAV for investors
Asset’s equity share price and net asset value are not the same. The calculations are different because only a company’s liquid assets are considered when determining the price of equity shares.
In contrast, both liquid and non-liquid assets are valued when calculating the NAV.
An asset’s net value indicates how the underlying assets have fared in prior years.
Note
The difference between NAV and Shareholder’s Equity is that NAV only includes tangible assets, while Shareholder’s Equity includes intangible assets like intellectual property, brand recognition, or goodwill.
Fund performance
Funds usually take the difference between the NAV on January 1st and December 31st for a percentage change. This percentage change is usually the basis year over year-over-year (YoY) fund performance.
For example, if the NAV of the fund increases from $60 in the beginning of the year to $63 in the end of the year, then the fund has generated a YoY return of 5%. The YoY numbers are usually the headline numbers most people see in the media and finance content.
The YoY reporting isn’t mandatory but is common practice for all funds that try to appeal to investors. What is mandatory, however, is the reporting of NAV daily.
These daily percentage changes are displayed, and their percent changes are calculated just like YoY, but daily percent gains or losses don’t mean much to fund investors with a longer-term horizon.
Pricing
The way funds are priced differs when it comes to mutual funds versus ETFs.
Mutual Funds
- Pricing based on NAV
- It’s a mandatory obligation for NAV to be calculated at the end of each trading day
- If investors place purchase or sell orders during market hours, the transaction will be executed at the NAV at the end of the day
Example: Mutual fund, DEF, has assets worth $1,000, $500 of liabilities, and 100 common shares outstanding. The NAV per share would be $5.
Exchange-Traded Funds (ETFs)
- Pricing is based on the supply and demand of the public markets, not NAV
- ETFs trade on the stock exchange just like any other security on public markets
- NAV for ETFs is still calculated at the end of the day, just like mutual funds
- The ETF trades at a premium if its price is higher than its NAV
- The ETF trades at a discount if its price is lower than its NAV
Example: An ETF, DEF, has a NAV of 50$ per share. If DEF was traded at $58, that would be an $8 premium. If DEF was traded at $42, that would be a $8 discount.
Distribution Adjustments
It refers to any changes made to the fund’s NAV. There are three main adjustments that change NAV for a fund.
- Dividend Income: Income earned from fund’s investments in publicly traded companies or other income generating assets.
- Capital Gains: Profits from the sale of securities.
- Interest Income: Income earned from bonds or other types of debt instruments.
What happens to NAV?
For example, if NAV is $25 and the fund declares $5 of distribution, the NAV will go down to $20.
Although, when NAV drops, shareholders receive an equivalent value in cash or additional shares, so the actual shareholder’s total wealth is unchanged.
Benchmarking
Benchmarking compares a fund’s performance against an index to gauge how well the fund is performing relative to the broader market.
The most common benchmark by far is the S&P 500. If the mutual fund or ETF outperforms the S&P 500 in 99 out of 100 scenarios, that is an exceptional job well done.
Outcompeting the S&P is already incredibly difficult on its own, and outcompeting it over the span of an entire career on an average basis is extraordinary and definitely not the norm for an average active investor.
Sometimes, a financial professional could use the Capital Asset Pricing Model (CAPM) on a mutual fund to find performances of the fund of interest or other funds to benchmark off of.
Re = Rf + B * (ERP)
Or
Re = Rf + B * (Rm - Rf)
Where:
- ‘Re’ = Expected returns, cost of equity, or required return.
- ‘Rf’ = Risk-Free rate.
- The current yield on long term bond, normally a 10-year or 20-year treasury which hovers around
- ‘B’ = Beta.
- Beta is calculated as the riskiness of comparable companies
- ‘ERP’ = Equity Risk Premium.
- The percentage by which stocks are expected to out-perform riskless assets.
- ‘Rm’ = Average return on capital market
CAPM will aid in finding an estimated return based on associated current risks to see where the fund stands in outperforming the S&P or other industry related benchmarks.
Investment Decisions
Investors don’t have to but it's highly recommended that they use criteria other than purely NAV when evaluating investment funds, because NAV fluctuations aren’t an accurate indicator of mutual fund performance.
Utilizing NAV is useful in understanding a fund's daily fluctuated performance, but not its return.
Investors should contemplate and analyze any of these various factors before mobilizing cash for any investment fund:
- Cost of buying shares in a mutual fund
- Management performance fees for actively managed funds
- Management performance fees for passively managed funds
- Historical/empirical performance
- Risks and exposure to certain industries or geographies
- Macro Environment
Mutual funds distribute any excess income accumulated from their basket of securities, usually in the form of dividends and interests, to their shareholders. The cumulative realized capital gains must be distributed to the shareholders.
NAV decreases as income and gains are distributed back to shareholders, so a reliable indicator to measure mutual fund performance is an annual return or the compound annual growth rate (CAGR).
| Closed-End Funds | Open-End Funds |
|---|---|
| A predetermined number of shares in a single offering to raise the required capital | Price their shares once per day |
| The offering is considered “closed” once the shares are sold | The price per share is equivalent to NAV |
| Can be traded at prices vastly different from NAV | Can issue unlimited shares and buy back |
| Listed on the exchanges similar to stocks and bonds, thus NAV rarely matches its price per share | Does not trade on exchanges |
| It is bought through a brokerage account. | Most mutual funds, including those in 401Ks, are open-ended |
| Still calculates NAV for reporting purposes, but NAV is calculated in real-time many times per minute | It is bought through an investment firm that sponsors the fund. |
Example of NAV Calculations
Goldman Stanley manages a mutual fund and needs to access the NAV for a single share.
The following is the firm’s financial information:
- Value of securities in a mutual fund at closing: $87,500,000
- Cash and cash equivalents: $11,000,000
- Accrued income: $37,500
- Accrued Expenses: $7,500
- Short term liabilities: $1,500,000
- Long term liabilities: $7,000,000
- Shares outstanding: 12,500,000
The line items have to be divided into more or less that represent assets and liabilities in NAV.
| Figure | Asset (+) or Liability (-) | |
|---|---|---|
| Values of Securities in Mutual Fund at Closing | $87,500,000 | + |
| Cash & Cash equivalents | $11,000,000 | + |
| Accrued income | $37,500 | + |
| Accrued expenses | $7,500 | - |
| Short term liabilities | $1,500,000 | - |
| Long term liabilities | $7,000,000 | - |
Assets Total: 87,500,000 + 11,000,000 + 37,500 = 98,537,500
Liabilities Total: 7,500 + 1,500,000 + 7,000,000 = 8,507,500

For the given day, the mutual fund shares will be traded at $7.2024 per share.

Free Resources
To continue learning and advancing your career, check out these additional helpful WSO resources:


or Want to Sign up with your social account?