Vatic Labs Overview
Vatic Labs Job Openings
No jobs found.
Vatic Labs Stats
The average hours worked chart shows the distribution of average hours worked per week generated based on the Compensation data at this company.
The number you see in the middle of the doughnut pie chart is the adjusted average of these scores. If you hover over the various sections of the donut, you will see the % breakdown of each workload given.
The percentile score in the title is calculated across the entire Company Database and uses an adjusted score based on Bayesian Estimates (to account for companies that have few interview insights). Simply put, as a company gets more data points, the confidence of a "true measure" increases so it is pulled closer to its simple average and away from the average of the entire dataset.
- 10-20 Hrs
- 20-30 Hrs
- 30-40 Hrs
- 40-50 Hrs
- 50-60 Hrs
- 60-70 Hrs
- 70-80 Hrs
- 80-90 Hrs
- Over 90 Hrs
The Interview Experience is a score from 1 star (very negative) to 5 stars (very positive) generated based on the Interview Insights at this company.
The number you see in the middle of the doughnut pie chart is the simple average of these scores. If you hover over the various sections of the donut, you will see the % breakdown of each score given.
The percentile score in the title is calculated across the entire Company Database and uses an adjusted score based on Bayesian Estimates (to account for companies that have few interview insights). Simply put, as a company gets more reviews, the confidence of a "true score" increases so it is pulled closer to its simple average and away from the average of the entire dataset.
- Very Negative
- Negative
- Neutral
- Positive
- Very Positive
The Interview Difficulty is a score ranging from very difficult (red) to very easy (green) generated based on the Interview Insights at this company.
The number you see in the middle of the doughnut pie chart is the simple average of these scores. The higher the number, the more difficult the interviews on average. If you hover over the various sections of the doughnut, you will see the % breakdown of each score given.
The percentile score in the title is calculated across the entire Company Database and uses an adjusted score based on Bayesian Estimates (to account for companies that have few interview insights). Simply put, as a company gets more insights, the confidence of a "true score" increases so it is pulled closer to its simple average and away from the average of the entire data set.
- Very Easy
- Easy
- Average
- Difficult
- Very Difficult
The Military Friendly chart shows the % of interviewed candidates that were in a military program or involved in the military at some point. If you hover over the the pie chart, you will see the % breakdown of military and non-military candidates.
The percentile score in the title is calculated across the entire Company Database and uses an adjusted score based on Bayesian Estimates (to account for companies that have less data).
Simply put, as a company gets more interviews, the confidence of a "true score" increases so it is pulled closer to the simple company average and away from the average of the entire data set.
The higher the percentile, the more likely this company is to grant an interview to someone with a military background.
The Sports Matters? chart shows the % of interviewed candidates that played a varsity sport in their undergraduate university. If you hover over the the pie chart, you will see the % breakdown by Varsity Athletes and Non-varsity athletes. The percentile score in the title is calculated across the entire Company Database and uses an adjusted score based on Bayesian Estimates (to account for companies that have less data).
Simply put, as a company gets more interviews, the confidence of a "true score" increases so it is pulled closer to the simple company average and away from the average of the entire data set.
The higher the percentile, the more likely this company is to grant an interview to a varsity athlete based on our data.
- Yes
- No
Company Details
Prop-Trading shop. They do automated trading highly focused on technology, including HFT and AI.
The word vatic means to describe or predict what will happen in the future, and that’s exactly what we do. Vatic Investments is a quantitative trading firm where traders, AI researchers, and technologists collaborate to develop autonomous trading agents and cutting edge technology. We work together, building systems that boost market efficiency and transparency.
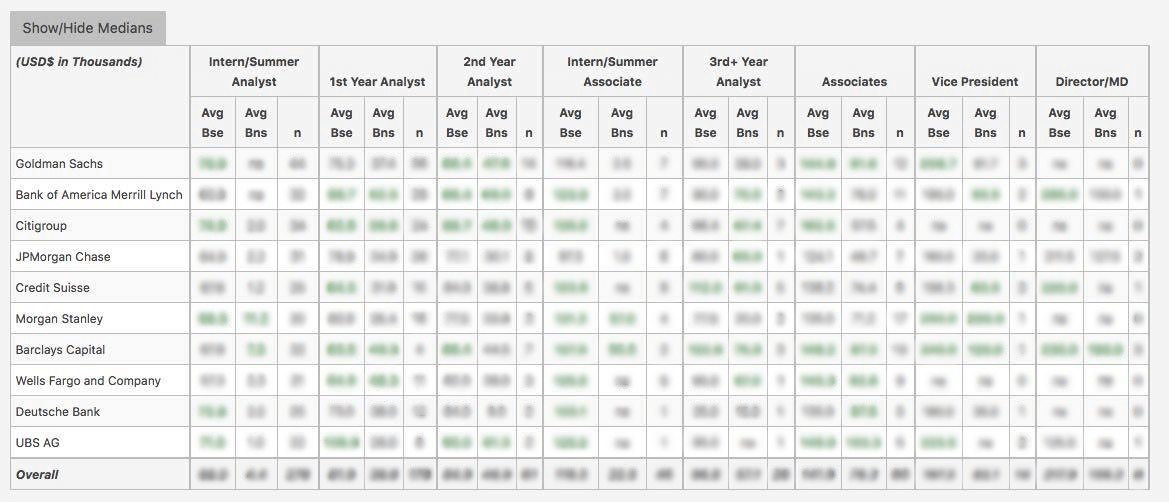
WSO Company Database Comparison Table
Vatic Labs Interview Questions
or Want to Sign up with your social account?