STANDARDIZE Function
An Excel Statistical function, also known as the Z-Score, is a tool to help users normalize a value using the mean and standard deviation.


What is the STANDARDIZE Z-Score Function?
The STANDARDIZE function is an Excel Statistical function, also known as the Z-Score, is a tool to help users normalize a value using the mean and standard deviation.
In 1968, assistant professor Edward I. Altman created the Altman Z-score, which can determine the likelihood of a firm going into bankruptcy within two years.
Once the Altman Z-score is calculated using profitability, leverage, liquidity, and other vital statistics, the value is found along the table that determines if the bank is at risk of going bankrupt and how significant the trouble is.
The classic z-score has implications in many disciplines. Comparing a data point to all others in a population is necessary to understand whether it is closer to average or more of an outlier.
Important examples of using a z-score include comparing the efficacy of a new drug to existing ones or comparing a stock’s growth to other similar companies.
- The STANDARDIZE function in Excel, also known as the Z-score function, standardizes a value based on the mean and standard deviation of a dataset.
- A z-score determines a data point’s distance to the mean, using the standard deviation as the unit of measurement, assuming the data set is usually distributed.
- A negative z-score indicates that the mean results are lower than them, and a result with a positive z-score may indicate a value greater than the mean.
- The STANDARDIZE function is used in statistical analysis to compare and analyze data points measured in different units or scales.
What is a Z-Score?
Z-scores are an essential part of basic statistics. They indicate where a data point lies within a distribution and show the number of standard deviations between the data point and the mean.
Note
Positive z-scores indicate the value is above the mean, whereas negative z-scores indicate that the value lies below the mean.
For example, if the z-score is 2.4, the data point lies 2.4 standard deviations above the mean. Similarly, if the z-score is -2.4, the data point lies 2.4 standard deviations below the mean.
Z-scores are based on the normal distribution, a standardized symmetrical bell curve. This curve has implications throughout advanced statistics.
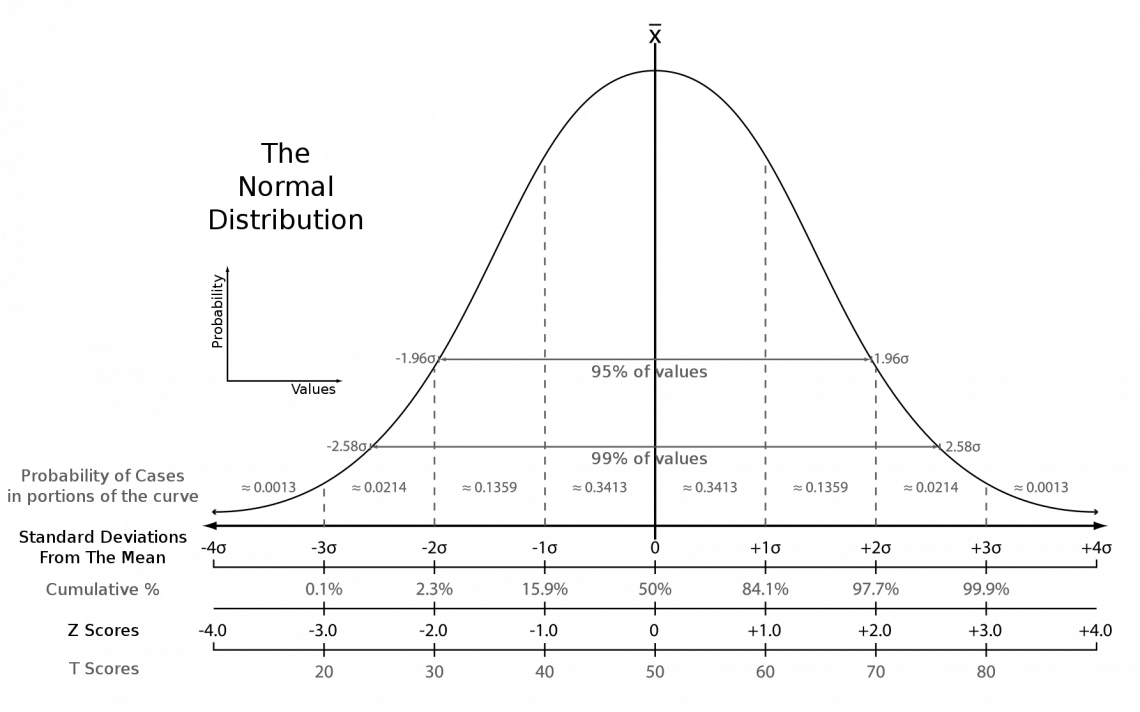
The numbers shown along the bottom of the graph are the z-scores that correspond with a certain point, and the point where the z-score is 0 is the mean.
The points that contain z-scores between -1 and 1 enclose 68% of the data. The facts that include z-scores between -2 and 2 have 95% of the data, and the area between z-scores of -3 and 3 contains 99.7% of the data.
You may wonder why the distribution only encompasses 99.7% of data, and this is due to outliers.
Outliers are data points that lie significantly far from the mean and are always assumed to be present in a data set. Thus, it would be inaccurate to say 100% of data points lie within a normal distribution.
These percentages are essential when determining the area under a standard distribution curve. This could be the area between two z-scores, above a z-score, or below a z-score.
This can be easily estimated if the z-score is a whole number, but it is challenging to do by hand if it isn't.
For example, if we were determining the chance that a data point falls below the z-score of 1, we would have to add 50% and 34%.
50% is the chance that a data point falls under the mean, and 34% is the chance a data point lies between the z-scores of 0 and 1. This results in an 84% chance.
The z-score can be calculated by using a precise formula:
z = (x - µ)/σ
Where,
- x is the data point for which you are finding the z-score
- μ is the population mean
- σ is the population standard deviation
Note
If the population parameters are not given, the sample mean and standard deviation can be used instead. It has the potential to be slightly less accurate, but it works.
Z-Score Formula
To make finding the z-score easier, users can use an Excel function.
The function is as denoted below:
=STANDARDIZE(x, mean, standard_dev)
Where,
- x (required) is the value for which you are finding the z-score
- mean (required) is the sample mean
- standard_dev (required) is the sample standard deviation.
Before looking at examples of using the z-score standardization function, let's explore ways to calculate the arguments for the process easily. We can begin with finding the mean through Excel. This uses the average process, denoted as
=AVERAGE(number1:number2)
Where number 1 and number 2 are a list of cell names separated by commas or cell names separated by a colon to indicate a range of cells.
The third argument of STANDARDIZE is the standard deviation, which can also be calculated from data points through an Excel formula. The syntax of this function is
=STDEV(number1:number2)
Numbers 1 and 2 are either a list of cells separated by commas or cell names that enclose a range of cells separated by a colon.
Using these supporting functions will make using the z-score standardization function simpler.
Earlier, we discussed finding the area under a normal distribution curve using a z-score and how it isn't easy to do by hand with non-integers. But, there is an Excel function to help calculate the area under the curve. The formula is
=NORMSDIST(z)
Where z is the normalized z-score that can be calculated using the STANDARDIZE function, this function outputs the probability of a value in the data set having a z-score lower than that entered into the function.
When subtracted from 1, the resulting probability is the chance that a value in the data set has a higher z-score. Additionally, the probability of a data point having a z-score between two z-scores can be found by subtracting one NORMDIST value from the other.
Calculating Z-Score
We can solve an example by hand and in Excel. Doing one example each way will help show the similarities and differences between the two methods and emphasize Excel's efficiency.
Say you are given the following set of 16 fishermen and the number of fish they caught for the day, and you want to find the z-score for the value 13. The data is normally distributed.
25, 6, 19, 13, 20, 19, 21, 21, 16, 20, 24, 18, 19, 20, 7, 20
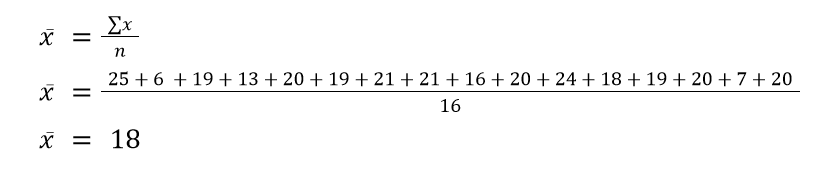
Notice how we are not given a population mean (μ) or population standard deviation (σ), so we will need to calculate the sample mean (x̄) and standard deviation (s) for this example.
The first step is to find x̄, which is the sample mean:
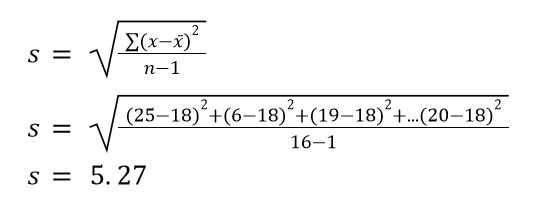
The next step is to find s, which is the sample standard deviation:
Now we have all the necessary information to calculate the z-score of 13. All we need to do is plug the values into the formula:
z = (13 - 18)/ 5.27
z = -0.95
Here, we find that 13 has a z-score of -0.95, which means it is 0.95 standard deviations below the mean of 18.
How to use the STANDARDIZE Z-Score Function in Excel?
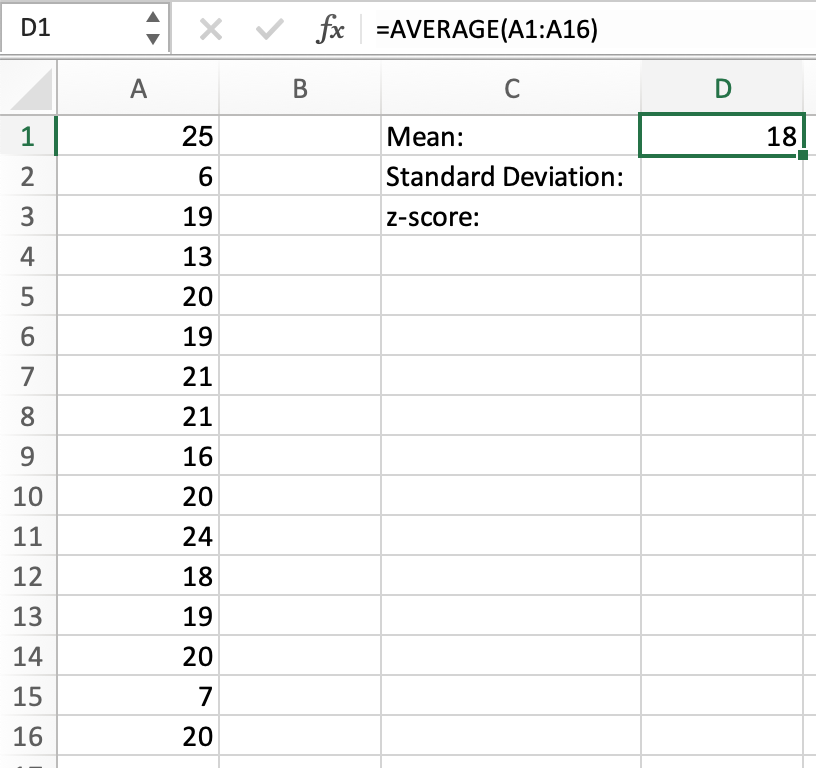
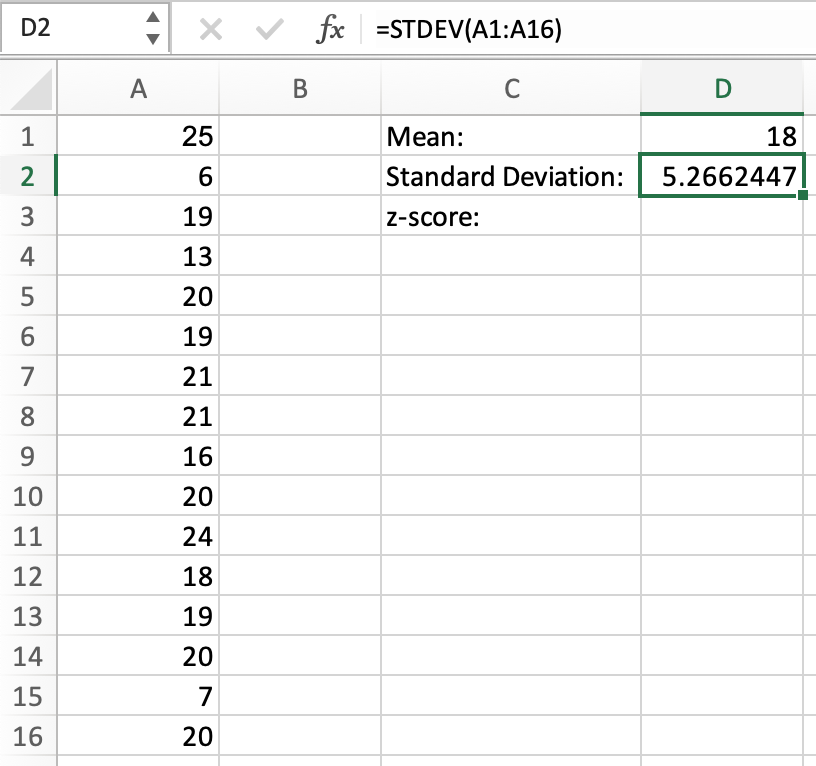
We can do the same problem using Excel. We have our 16 data points typed into a sheet, so our first step will be calculating the mean. We can use the AVERAGE function, as seen below:
Next, we calculate the standard deviation using STDEV:
Now that we have all three values we need, we can calculate the z-score using STANDARDIZE. We can use cell names for each argument instead of manually typing them in.
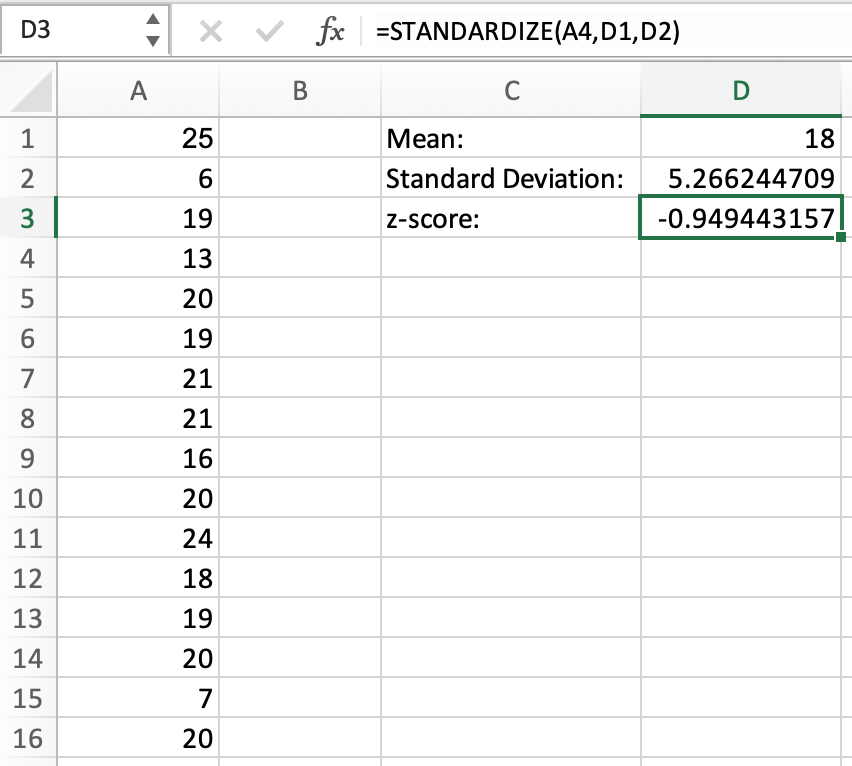
As seen above, the z-score of 13 is -0.95, the same value we got when we calculated this by hand.
We can take this further by determining different probabilities with the z-score. First, we can determine the probability that a value in this data set has a z-score under -0.95. This can be seen below:
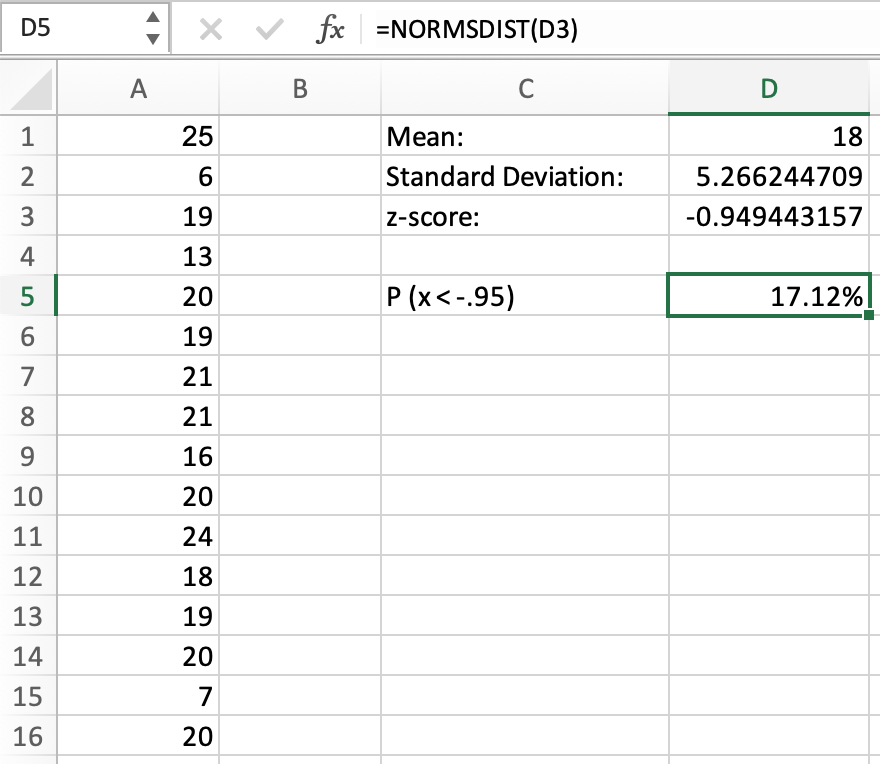
There is a 17.12% chance that the value of the data set will be lower than 13. But what if we wanted the chance of a value being higher than 13? We simply need to subtract the percentage from 1, as shown below:
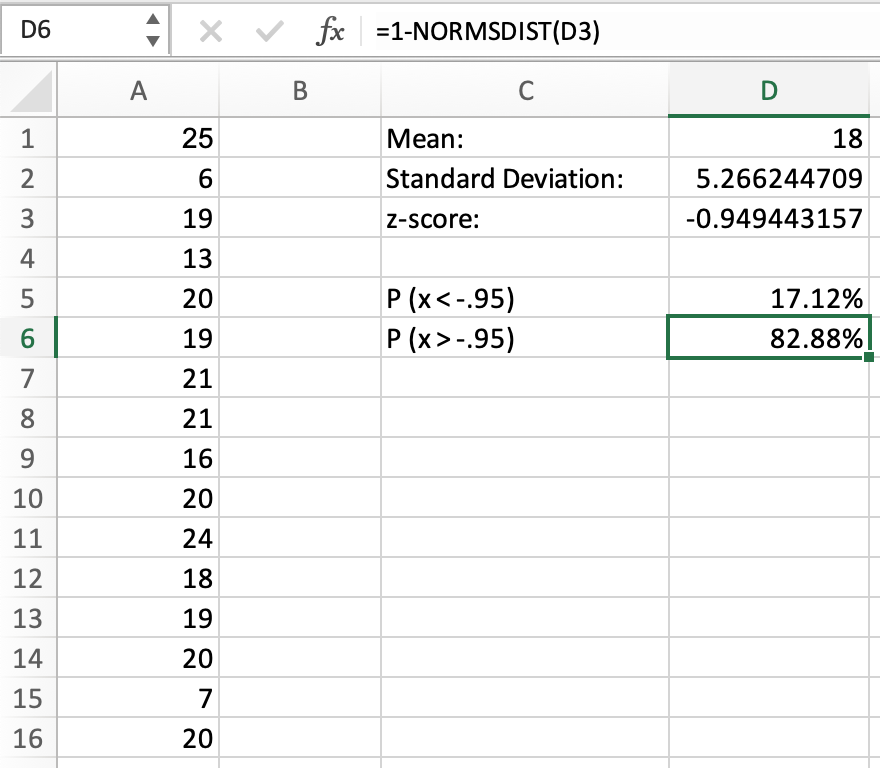
This indicates an 82.88% chance that a value will be higher than 13 (or have a z-score higher than -0.95).
We can complicate this slightly by finding the probability of a value having a z-score above -0.95 and below 0.95. As shown in the image below, we need to subtract the areas of each to get the difference.
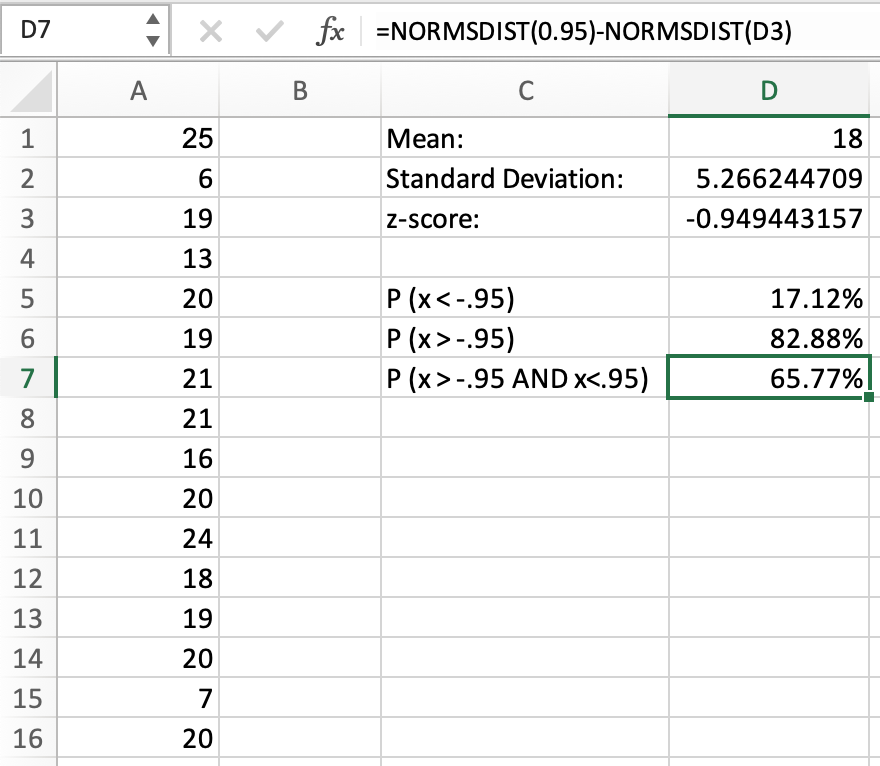
This indicates a 65.77% chance of a value having a z-score between -0.95 and 0.95.

Free Resources
To continue learning and advancing your career, check out these additional helpful WSO resources:


or Want to Sign up with your social account?