
Supervised vs Unsupervised Learning
The difference between supervised and unsupervised algorithms depends on whether they use labelled or unlabelled data, which dictates their outputs and how they operate.
What is Supervised vs Unsupervised Learning?
Supervised learning is the use of historical data to predict outcomes and classify data. With the help of clearly labelled training data (trains the algorithm with correct facts and conditions), supervised learning is a powerful tool with various applications across industries.
On the other hand, unsupervised learning uses large unlabelled datasets to train models to recognise and discern patterns in the data. These patterns are useful for flagging anomalies and assessing correlations within industries such as banking and finance.
Different scenarios call for different approaches. For example, supervised learning algorithms thrive in the banking sector, while unsupervised algorithms are largely used in financial markets.
These algorithms are tailored for different data types and sources, each with unique nuances.
In short, before deciding to implement machine learning algorithms into your processes, it is key to understand what sort of data you’re working with to ensure ideal outcomes. As the saying goes, “Trash in, Trash out.” Let’s look at a few examples and dive deep into supervised learning.
- The difference between supervised and unsupervised algorithms depends on whether they use labelled or unlabelled data, which dictates their outputs and how they operate.
- Diagnosing business needs from the data source is both detrimental and necessary for deducing the optimal machine learning procedures.
- Supervised learning algorithms are perfect for situations where labelled data is both readily available and easily accessible.
- Unsupervised learning is ideal for scenarios where data is large in quantity but not readily labelled for model training.
- Aligning data goals with machine learning approaches is the key to delivering the right predictions and the right outputs.
Examples of Supervised Learning
A basic example of a supervised learning process would look like the following:
- Train the model with labelled images of fruit types
- Introduce data sets with fruits and other food types to the model
- Task model to classify data into fruit types and non-fruit.
With the information learnt from its training data, the resulting model will now be able to classify fruits into different types and recognise previously unseen fruit.
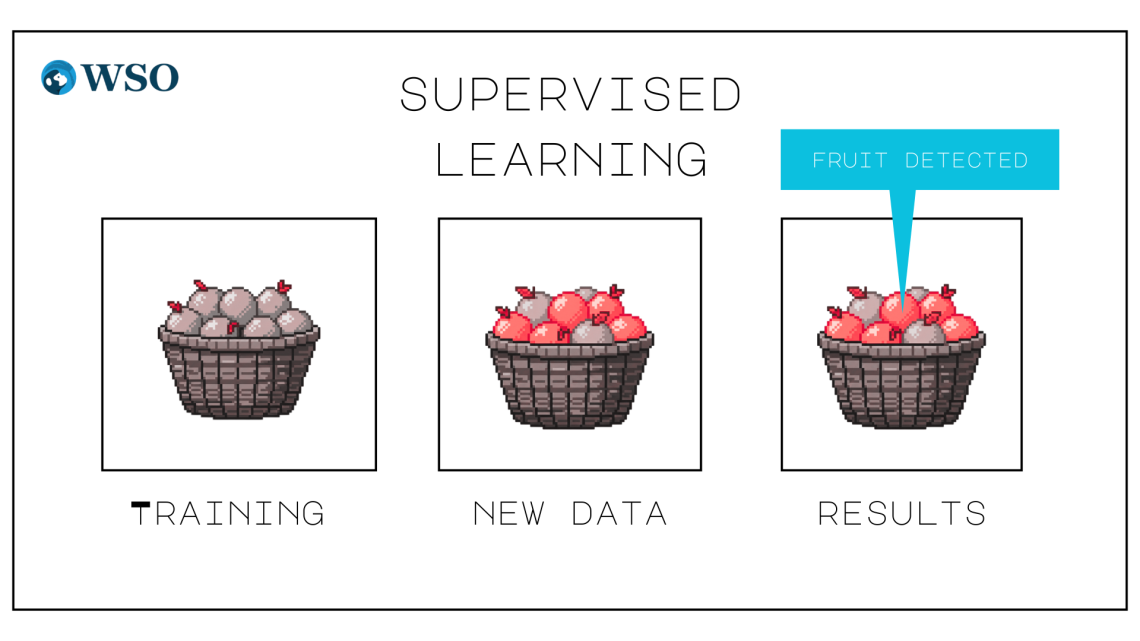
The example before used image classification algorithms to sort the data into our desired categories: fruit and non-fruit. With different supervised learning algorithms, it is clear that the use cases for supervised learning are endless.
Supervised Learning Algorithms
United by the need for labelled training data, these function-specific algorithms are widely used across all industries, but they all differ in their inherent constraints and benefits.
The main algorithm types are broken into:
- Regression
- Classifier
These algorithms have sub-branches with unique nuances, separated by their methods and outputs, which we will dive into further below.
Regression
Regression algorithms are responsible for supervised learning’s predictive applications (often outputting a numerical response), such as predicting tomorrow’s rainfall or UV index.
There are different types of regression algorithms, each with its own uses and nuances.
- Linear Regression: Linear regression models use variables to predict future changes using a simple mathematical formula, achieving high accuracy due to their staple nature in statistics. Their applications range from visualising real-time data to calculating sport analytics
- State space model (drop-down): State space models are a dimensional extension of linear regression that focus on the evolution of their internal states. These internal states are essentially higher-dimensional variables that dictate their predictions, with applications in electrical engineering and physics
- Lasso Regression (drop-down): Lasso regression, or L1 regularisation, is a method of penalising overfitting (bias caused by datasets that match the training data). They have extensive applications within genomics and finance (stock price predictions) due to their complex data sets and training data
- Ridge Regression (drop-down): Ridge regression, or L2 regularisation, is a method for reducing the difficulty of distinguishing causation from variables that are multicollinear (i.e., influencing each other). It is used in areas with many parameters, such as biostatistics and real estate pricing predictions
- Time series (drop-down): Time series models are similar to linear regression models, except they focus solely on forecasting with time as the independent variable. These models are largely seen within the predictive spaces of weather, seasonality of business, and trend analysis
- Autoregressive model (drop-down): An Autoregressive model is an advanced version of the time series model, which forecasts future outputs with multiple data points from their own time series to measure the correlation of variables and itself, with applications in natural language processing and spatial data analysis
Classifiers
Instead of predicting numerical outputs, classifiers are tasked with calculating the probabilities of discrete categories (classes) such as high risk or low risk. These classes form the foundation of financial applications, such as determining whether to approve a loan, which returns a yes or no.
There are numerous applications of classifiers across many industries, all determined by the nuanced attributes of each classifier type.
Classifier algorithms
Let’s understand a few classifier algorithms below:
Logistic regression (drop-down)
Similar to linear regression, logistic regression follows a similar model but is instead specifically used for classification. It starts by determining the probability of an outcome using functions similar to those in linear regression, and then predicts a class based on that probability.
It is also a stable within the machine learning world due to its simplicity and reliability, making it widely adopted throughout the technological space. For example, it could be used for loan approvals, fraud screening, and customer analytics.
Decision trees (drop-down)
By mapping out all possible responses through splitting the data into smaller chunks using an if-then approach. Decision trees make predictions by visualising routes that eventually split into a classifier (categorical output) and choosing the one that matches the ideal outcome.
This simple model is prone to overfitting and bias, as small tweaks to decisions can drastically shape the final classifier, making it best used in conjunction with more advanced algorithms that address these biases.
Random forest (drop-down)
Random forest algorithms are essentially collections of decision trees designed to more reliably classify data by reducing bias. Each decision tree is trained through different random samples of the training data, which reduces the effects of overfitting.
In doing so, they are less sensitive to small tweaks in datasets and remain bound by majority votes, which allows them to handle messy datasets commonly encountered in insurance settings for credit risk and fraud detection.
K-nearest neighbours (drop-down)
By looking at the closest examples in its training data, k-nearest neighbours (KNN) is a simple machine learning algorithm based solely on a distance measure between training data points. After calculating these distances, a class is then determined via majority vote.
These algorithms are sensitive to feature and data scaling, as noise can distort the distances used to derive their predictive output. Unless it is accounted for through signal pre-processing, it is used in smaller technological environments.
Naïve Bayes (drop-down)
Naïve Bayes is a probability-based classifier algorithm that is centred around Bayes’ theorem, where it estimates the probability of the class given the condition of the input data using the formula:

The algorithm is fast and is largely used for text classification. For example, filtering passages for relevant topics found in news articles, or even as a foundational model for detecting fraud in emails or text documents.
Support vector machine (SVM) (drop-down)
By using an optimal hyperplane, which is essentially a line that maximizes the margin between two classes built from its training data, support vector machine algorithms use this separation to predict the categorical class for their given data.
They are largely used in environments where datasets are not particularly large, and inputs are generally subtle. Such environments include credit risk and general text categorisation.
Ensemble
The ensemble approach combines multiple algorithms and models to achieve a more robust and accurate prediction and outcome, and comes in three different types, all differentiated through the timing of training and modelling:
- Bagging (drop-down): Bagging, or bootstrapping, is essentially training models on different data sets at the same time to stabilise the model and reduce overfitting. Majority voting can also be used to average predictions and reduce bias, as seen in the Random Forest algorithm
- Boosting (drop-down): Boosting approaches involve sequentially training models to correct mistakes from previous iterations, resulting in a gradual reduction in error. This approach is crucial in situations where data is messy and signals are prominent, as seen in financial fraud
- Stacking (drop-down): Stacking involves combining different models and feeding their outputs to train a “meta” model to appropriately adjust to each model's predictions and blend them to achieve a reliable prediction. This approach is most commonly used in situations with multiple data sources
For more in-depth technical knowledge on stacking, here is an academic coverage of its benefits: https://www.researchgate.net/publication/222467943_Stacked_Generalization
Self Supervised
An approach that sequences both Unsupervised Learning and supervised learning is self-supervised learning (SSL). Combining the two, self-supervised learning uses unsupervised methods to generate data labels for supervised algorithms to predict with unstructured data.
It is widely used in the financial space because it addresses the severe scarcity of high-quality labels, often caused by delayed and noisy financial signals.
What is Unsupervised Learning?
High-quality training data labels are often hard to come by in the machine learning space. Training models with unstructured data and finding hidden insights and patterns is the name of the game for unsupervised learning algorithms.
Instead of being trained on verified, labelled datasets, they require larger amounts of unlabelled data and more computation due to their unguided nature, leading to a fundamentally different approach to data.
Examples of Unsupervised Learning
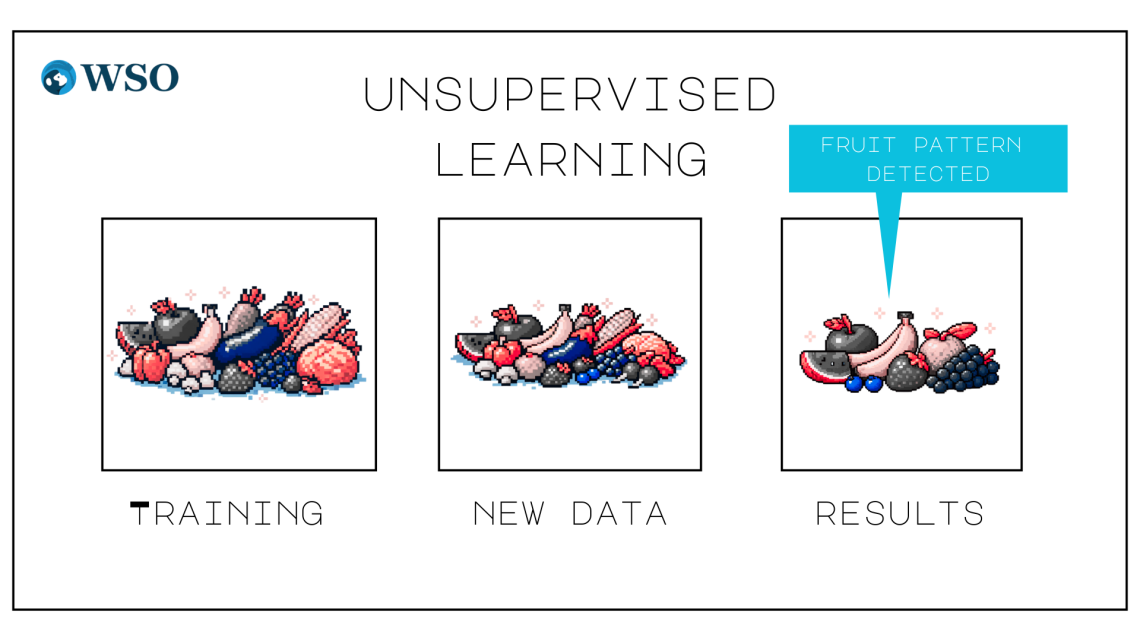
A basic example of an unsupervised learning process would look like the following:
- Feed the model with a considerable data set
- Introduce new data
- Task model to find patterns within the data
With information from its extensive database, the resulting model will now be able to reveal insights into the similarities among fruit features.
Unsupervised Learning Algorithms
Although unsupervised learning algorithms all rely on unlabelled pools of data, the main unsupervised algorithm types are broken into four different categories:
- Clustering
- Apriori
- Gaussian mixture model
- Anomaly detection
These categories are distinguished by their unique methods for finding patterns in their training data. Whether it be using probability distributions or grouping data points, these algorithms have wide-ranging applications with inherent nuances as seen below.
Clustering (drop-down)
Used for customer segmentation and market sector detection, clustering is ideal for grouping items by similarity or distance measures in order to separate data into key segments. This negates the need for pre-defined labels and provides valuable insight into data organisation.
Apriori algorithm (drop-down)
Using how often items occur together, Apriori algorithms use if-then rules to filter itemsets based on association (how often they occur together). This sort of algorithm is useful in areas where frequency is insightful, such as recommendation systems and market analysis.
Gaussian mixture model (drop-down)
A Gaussian mixture model (GMM) assumes that the data are composed of multiple Gaussian (Normal) distributions. These probabilities are especially useful when data boundaries between groups are blurry, and an insight is required.
Common use cases for the GMM include customer segmentation analysis, market regime timing (grouping time periods by geographic area), and, sometimes, as an anomaly detector for data points outside the general bell curve.
Anomaly detection (drop-down)
Mostly used in fraud detection applications and financial portfolio surveillance, anomaly detection algorithms are geared to filter anomalous data points from the pre-determined normal behaviour of their designated dataset. It is used when labels on deviated data points are scarce.
Semi-supervised Learning
A blend of both unsupervised and supervised learning, semi-supervised learning is a cost-efficient algorithm that uses both a small set of labelled data and a large pool of unlabelled data. In doing so, it creates labels for unlabelled cases and re-trains itself iteratively.
It is a useful algorithm in scenarios where labelled data is expensive or hard to obtain, making its cost-efficiency a considerable attribute in industries with small sets of high-quality examples, such as customer activity, fraud, and credit risk.
Why does Supervised Vs. Unsupervised Learning matter?
Whether it is supervised, unsupervised, or a blend of both, dealing with data with the right approach can be the difference between compounding inaccuracies and seamless integration. Understanding your specific needs is key. Different algorithms call for different scenarios.
Another key consideration in the risk management space is model complexity: the more complex and layered a model is, the less measurable and controllable it becomes.
Supervised Vs. Unsupervised Vs. Semi-supervised Learning
Let’s learn the basic difference between the three learnings in the table below:
| Model Type | Supervised | Unsupervised | Semi-Supervised |
|---|---|---|---|
| Advantages | Highly measurable performance and is more accurate. | Organises data and can be widely adopted without the need for high-quality labelled training data. | Perfect for environments where labels are scarce/delays, which blends both reliability and accuracy. |
| Disadvantages | Needs high-quality labelled data, which can be expensive, slow, and noisy. Time-consuming to manage. Has overfitting and bias concerns. |
Harder to validate predictions and is solely reliant on interpretability. Requires large amounts of data to produce accurate results. |
More complex and harder to alter. Can propagate faulty data labels, which calls for careful governance. |
| Algorithms used | Linear and Logistic regression, KNN, Random Forest, Decision Tree, Support Vector Machine, Neural Network, etc. | Clustering, Apriori Algorithm, Gaussian Mixture Model, etc. | A mixture of supervised and unsupervised algorithms. |
Supervised or Unsupervised, which is right for you?
Finalising your machine learning model can be difficult; when dealing with sensitive data, following the right procedures is crucial.
Provided below is a general framework for ensuring model compatibility:
- Figure out your needs (drop-down): Dissect your business needs by asking the following questions:What kind of insights do I need? Would I benefit from simplicity or complexity? What sort of data am I working with? How would this integrate with our existing platforms? Audit the available data, consider data quality, whether it is labelled, and frequency and timing.
- Test a simple model (drop-down): Simulate a simple model and consider all risks associated. Adopt risk management procedures in accordance with your model and its respective use.
- Monitor adoption (drop-down): Set up systems that measure the following: Data health (Changes in input and data), Output performance (Stability and goal alignment)
- Validate (drop-down): Examine whether the model aligns with your goals for the right reasons. Separate correlation from causation and recalibrate or replace the model accordingly.
Conclusion
Whether it is unsupervised or supervised, the algorithms you use should align with your business needs. For example, the timing and accuracy of data signals are the key to desirable performance, and so are the algorithms that work around them.
Dissect your data types, assess data availability, and finally ask whether you want to predict future outcomes or find patterns in unstructured data. Answering each of those questions ensures you’re using the right algorithm, saving you both unnecessary headaches and costly expenses.
Remember, despite following the right steps and picking the right algorithms, AI is still relatively new, and unforeseen circumstances may disrupt model performance. Governance is equally as important as application, so plan extensively.
Free Resources
Please check out the following additional resources to help you advance your career:


or Want to Sign up with your social account?