Head and Shoulders Pattern – Technical Analysis
Chart pattern that resembles a baseline with three peaks


What Is the Head and Shoulders Pattern?
A head and shoulder pattern is a chart pattern that resembles a baseline with three peaks, with the center peak standing out as being the tallest and the outer two peaks being extremely close in height.
A chart structure known as a head and shoulders pattern in technical analysis foretells a bullish-to-bearish trend reversal. This pattern formation is one of the best patterns for a trend reversal.
This top design is only one of many that, in differing degrees, signal the end of an upward trend. This pattern is formed when a stock's price rises to its peak and then falls back to where it started its uptrend.
The price increases above the prior high to create the "head" before returning to the initial base. Finally, the stock price experiences a second peak close to the formation's first peak before declining again.
After rising over the prior high to generate the "nose," the price drops to the initial base. The stock price then rises once again, but only to the initial peak of the pattern, before dropping once more to the neckline or base.
Traders and analysts regularly scan the market for trends and patterns to predict the next most likely price movement. Finding patterns, correctly identifying them, and understanding their significance are essential for effective trading.
This pattern has historical significance since market analysts have used it. Below, we'll go into more depth regarding this pattern, highlighting its significance and demonstrating how you can benefit from it.
This pattern formation is one of the best patterns for trend reversal. This top design is only one of many that, in differing degrees, signal the end of an upward trend.
Formation of the Head and Shoulders Pattern
The pattern begins with a price rise and ends with a price pullback (lower), generating the left shoulder. This pattern only appears when the price is on an uptrend. A higher peak, referred to as the peak of the head, is produced when the price rises again.
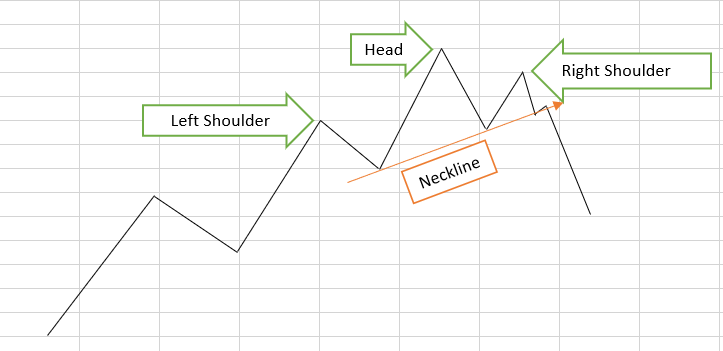
The price drops once again before rising to a lower peak, thus forming the right shoulder. Swing lows are reached when the price declines after the left shoulder and the head. Finally, a "neckline" is created by joining the swing lows with an extended trendline to the right.
The pattern is deemed complete, and the probability of further downward movement increases when the price drops below the neckline. Understanding the formation of head-and-shoulders patterns helps spot actual trend analysis.
In short,
- Left shoulder: A price increase, a price peak, and a price fall.
- Head: A new price increase has formed a higher peak.
- Right shoulder: The right peak, lower than the head, is formed by a dip followed by a rise.
These three chart patterns are among the most straightforward to misunderstand but can be excellent signs of a significant trend reversal. Indeed, many investors have suffered significant losses from making trades before receiving confirmation of the pattern.
How to Trade the the Head and Shoulders Pattern?
Traders must hold off until the pattern is finished. This is true because a pattern might not emerge or finish developing in the future. So watch for incomplete or almost finished patterns, but wait to trade until the pattern breaches the neckline.
After the peak of the right shoulder in the pattern, we watch for price action to move lower than the neckline. After the right shoulder has developed, we watch for price movement above the neckline to confirm the inverted head and shoulders pattern.
A trade can be initiated after the pattern is complete. Before the trade, make a note of the entry, stops, and profit targets, as well as any potential influencing factors.
When the neckline is broken, it is the most common breakout point where the trade is entered. A different entry point necessitates more perseverance and increases the chance of completely missing the move.
This technique entails waiting for a neckline pullback after a breakout has already taken place. This is more cautious since we can see that if the retreat ends and the breakout trend returns, the trade may be lost if the price continues to move in that direction.
Market Actions
Like other charting patterns, This pattern's ups and downs reveal a very clear narrative about the conflict between bulls and bears.
The first high and subsequent decrease signify the bullish trend's decreasing vigor. Bulls drive the price back up over the first peak to hit a new high to extend the upward direction (the head). Bulls might yet take back control of the market at this time and maintain the upward trend.
However, it becomes evident that bears are gaining control as the price drops a second time and hits a level below the first peak. Bulls attempt to drive the price up but can only reach the lower high set during the initial peak.
The bears now control the market due to the bulls' inability to reach the greatest high, which causes the price to decline and complete the reversal.
Although we think more needs to be done to promote domestic issuance by the corporate sector, it is crucial to keep in mind that Australia has built up its bond market infrastructure over many years with a recent concentration on corporate markets.
Placing Your Stops: After the neckline is penetrated in the typical market top pattern, the stops are positioned slightly above the right shoulder. As an alternative, the pattern's head can be employed as a stop; however, this entails significantly higher risk and lowers the pattern's return-to-risk ratio.
The stop is positioned just beneath the right shoulder in the reverse pattern. Once more, the trader is exposed to more danger when the stop is set near the pattern's head.
Setting Your Profit Targets: The pattern's profit target is the difference in price between the low point of each shoulder and the head.
This difference is subtracted from the neckline's breakout level to determine the downside's price. An upward price goal is established by adding the difference to the neckline breakout price.
What Is an Inverse Head and Shoulders?
A head and shoulders pattern inverted, also known as a "head and shoulders bottom," is similar to the regular pattern in that the top is used to forecast downtrend reversals.
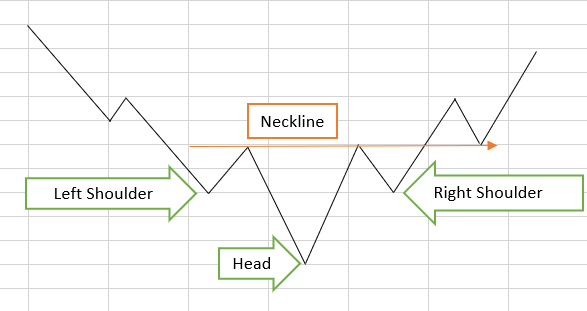
A pattern occurs when a security's price action has the following features. First, the price of security falls to a trough and then rises. Then the price drops below the first trough and then rises once again.
The price moves higher toward the resistance close to the top of the prior troughs once the last dip is produced. Typically, investors take a long position when the price exceeds the neckline's resistance.
The shoulders are the first and third troughs, while the head is the second apex. A rise higher is predicted by a move over the neckline, also known as resistance. Many traders wait for a significant increase in volume to show that the breakout is real.
Although it is used to forecast movements in a decline rather than an upswing, this pattern is the reverse of the well-known head and shoulders pattern.
The distance between the bottom of the head and the pattern's neckline may be used to forecast how far the price might move in the breakout direction and to determine an appropriate profit target.
In short,
Left shoulder: Price decreases, a price bottom, and an upswing.
Head: Price drops once again, creating a lower bottom.
Right shoulder: Price rises before falling to create the proper bottom.
Why does Head and Shoulders Pattern Work?
No pattern is flawless, and it doesn't always work. However, there are several reasons why the theoretical chart pattern works:
- There is less aggressive purchasing as prices decline from the market high (head). Sellers are starting to enter the market.
- Many investors who bought during the right shoulder rally or the last wave higher are now facing substantial losses since they bought at the wrong time.
- As the neckline approaches, these investors will be the ones to exit their positions, which will drive the price in the direction of the profit target.
- The right shoulder is unlikely to be broken until an uptrend restart; thus, the stop above it makes sense, given that the trend has changed to one of decline.
- The profit goal is based on the idea that individuals who made mistakes or bought the security at a bad moment would be compelled to sell, leading to a reversal comparable in size to the topping pattern that just happened.
- At the neckline, many traders will feel pain and be compelled to close their positions, which will cause the price to move in the direction of the price objective.
- Additionally, the volume may be seen. We want the volume to increase as a breakout occurs during inverse formations.
- The price will move closer to the objective due to the increasing purchasing activity. However, volume is declining, which indicates a lack of enthusiasm for the upward advance and calls for some caution.
Pitfalls of Trading Head and Shoulders Pattern
As said, the pattern is not perfect. For example, the following problems might arise when using this pattern for trading:
- You must search for patterns and observe their development, but you shouldn't trade using this tactic until the pattern is finished. So, it can entail a protracted waiting period.
- It won't always function. Sometimes the stop thresholds will be reached.
- Since the profit objective won't always be attained, traders may want to adjust how market factors will influence when they sell a security.
- Trading the pattern isn't always possible. For instance, the predicted price objectives are unlikely to be met if one of the shoulders experiences a significant decline due to an unforeseeable incident.
- Patterns may be arbitrary. A shoulder may be visible to one trader but not to another. Given the general rules above, identify a pattern before trading it.
- Hard for novice traders. This pattern can appear without a flat neckline, confusing novice traders.
- The neckline may seem to move. The neckline might be reevaluated if the price retreats, puzzling some traders. Price changes near the neckline might be difficult for novice traders.
- Rates of risk vs. profit may not be favorable.
- It can take time to observe patterns as they emerge and evolve, just as with any investment plan, and even then, it may be challenging to spot the trends.
- It may also be quite challenging to reach your projected price objective due to changes in the stock market.
Head and Shoulders Pattern FAQs
A head and shoulder chart that is used to forecast uptrend reversals is called an inverted head and shoulders chart. A pattern exists when the price movement of security exhibits any of the following characteristics.
Price rises to a high, drops, rises again, but not to the next peak, before rising again. The price starts to decline after achieving the most recent peak and moves in the direction of the resistance that is close to the lowest point of the prior peaks.
The pattern consists of a "left shoulder," a "head," and lastly a "right shoulder," with a baseline and three peaks, the middle peak being the largest. Price declines, a bottom, and an upsurge are characteristics of the left shoulder.
The head is created when the price drops once again, establishing a lower bottom. The right shoulder is then formed by the price rising once again, followed by a decline that forms the right bottom.
A bullish-to-bearish trend reversal and a sign that an upward trend is likely to finish may be noticed on the head and shoulders chart. Investors consider it to be one of the most reliable patterns for trend reversals.
These patterns are statistically the most reliable of the price action patterns, hitting their forecasted objective about 85% of the time. Both highs (the shoulders) separated by the head make up the typical head and shoulders pattern.


or Want to Sign up with your social account?