Pivot Points
A technical indicator that provides an average of the previous day’s high, low, and closing trades.


What Is a Pivot Point?
Technical analysis is the practice of assessing chart patterns and using mathematical formulas incorporating chart variables, such as price history and trade volumes, to gauge market movements. Pivot points are a well-known technical indicator used by many day traders.
Pivot Points provide an average of the previous day’s high, low, and closing trades to assemble support and resistance lines.
Support and resistance lines can be considered as areas of market consolidation, a position where the value of the market is tested to judge whether an upward or downward momentum is strong enough to pass through or rebound off a respected price.
When the market value has reached support, there is more interest to buy. Alternatively, at a resistance point, there is more interest in selling. This can cause fluctuation between or along the lines of a trader's attempt to direct the market toward its intrinsic and/or extrinsic value.
The Formulas for Pivot Points
The formulas are set for the pivot point and multiple support and resistance lines.
Pivot Point (PP) = [High + Low + Close] / 3
Resistance 1 (R1) = (2 x PP) – Low
Support 1 (S2) = (2 x PP) – High
Resistance 2 (R2) = (PP – S1) + R1
Support 2 (S2) = PP – (R1 – S1)
Resistance 3 (R3) = (PP – S2) + R2
Support 3 (S3) = PP – (R2 – S2)
The previous day's values are inputted into the formula to analyze the market for the current day.
Weekly high, low, and closing values can be inputted into the formula to provide wider support and resistance levels to identify patterns and movements on a greater time scale. It can be adapted for the trading analyst’s strategy.
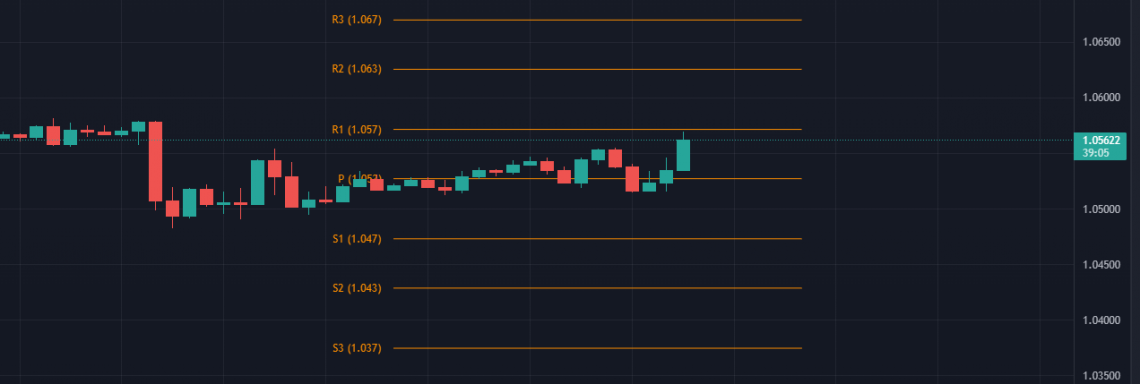
The PP value provides a baseline, with movement above the line signaling bullish sentiment and below signaling bearish sentiment.
Lines labeled S1, S2, and S3 represent the support lines, with ascending numbers providing support indications further below the PP. R1, R2, and R3 identify resistance lines above the PP.
How To Use Pivot Points
The effects of support and resistance lines have historically shown patterns, allowing pivot points to be used as barometers for risk.
Studies show the probability of the market dipping below S1 or breaking above R1 is approximately 40%.
Further, support and resistance lines, S2, S3, R2, and R3, have a lower probability of being met.
This enables investors to confidently and strategically enter or exit a trade for a greater chance of success.
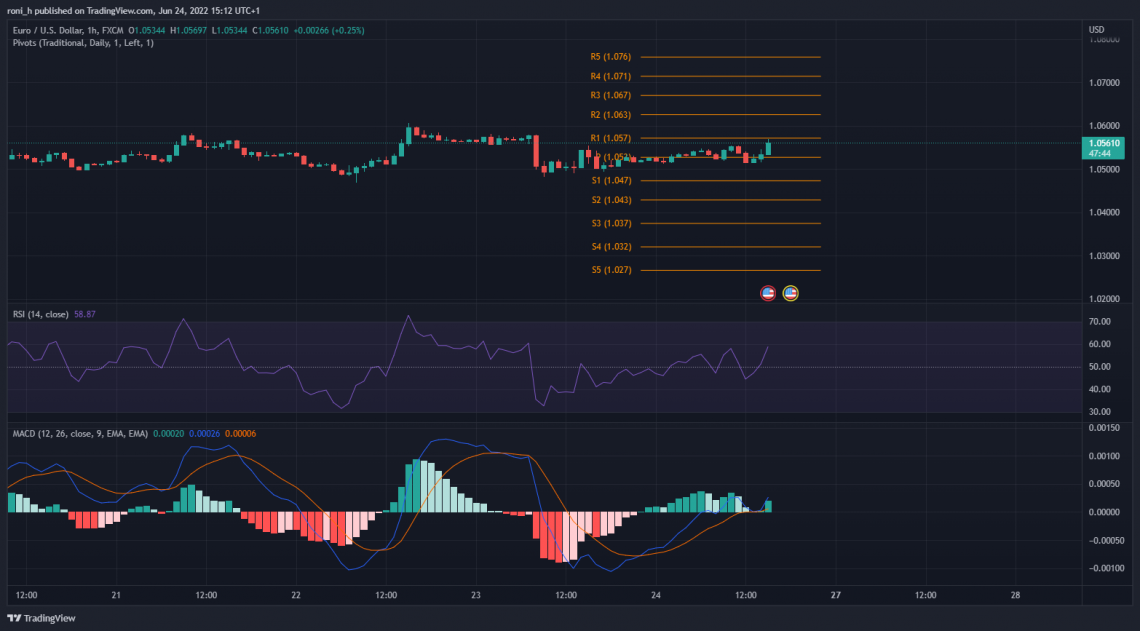
Other indicators should be used with pivot points, such as Moving Average Convergence Divergence (MACD) and Relative Strength Index (RSI).
A single pivot point indicator would provide limited insight into a market, whereas MACD and RSI can illustrate market momentum and divergence.
Fundamental analysis is a key process when concluding market positions using real-world data that can determine whether a market will perform well or regress.
A bullish market is demonstrated by the price moving above the PP, engaging with R1, where it is tested. The price could either retrace if there are more sellers than buyers or break through if there are more buyers than sellers.
A frequently used technique is to place a take-profit order slightly below R1 (assuming an initial long position at the PP) if the trader believes the market could retrace. This ensures a profitable trade.
On the other hand, buy orders can be placed above R1 if the trader believes the market will likely continue its rally beyond resistance. A combination of these two orders can be employed to take advantage of either movement.
Inversely, a decline in the market would test the support line, S1. This may convince traders to place a stop-loss slightly beneath S1 (assuming an initial long position at the PP) if they believe the markets would decline further, limiting any loss.
Market makers are more likely to buy at the first support as it is perceived as the lowest daily value.
When a trader bets the market will decline, a take-profit order can be placed above S1. Otherwise, a further decline can see a sell order being placed below S1.
Knowing when to enter and exit a market is crucial to maximizing profits and limiting potential losses.
Active traders will be taking different stances on the market based on the analysis and predictions they have concluded. Therefore, alternative views and positions will be traded, representing market consolidation, with the majority's interpretation succeeding.
Forex Market And Pivot Points
Forex market traders primarily use pivot points for their support and resistance lines.
The forex market is very liquid, especially for major currency pairs such as USD/GBP, and trades at high volumes.
This prevents the manipulation more commonly seen in the stock market that can result in wide fluctuations caused by institutional investors and large corporations.
Why day traders use this technical indicator:
- Highly accurate: It reflects the movement of yesterday’s price to determine possible trends that may be seen in the present day’s movement.
- Short time frames: It is typically used for daily points; however, smaller time frames, such as 15-minute intervals, can be calculated, and if the boundaries show reasonable correlation, it can be used as an effective method for trading.
- Easy to use: Although the calculation can be tedious when finding and inputting the variables yourself, many modern trading platforms automatically display pivot points for a given day.
Limitations Of Pivot Points
The indicator's pivot point serves as its foundation, but it also contains additional support and resistance levels that are estimated using the pivot point computation. Each of these levels aids traders in determining potential areas of support and resistance for the price.
But, even after being resourceful to the traders, there are a few limitations to the Pivot Points.
- The formula used to calculate pivot points and their respective support and resistance lines is very simple, making it less adaptable when traders endure volatile market conditions.
- The signal provided by them may give a false indication when the markets move erratically. This can lead to losses like proceeding with trades that appear bullish but end with a bearish outcome.
- Using any other complementing indicator can provoke misleading trends. This is because pivot points are used mainly to specify when to enter or exit trades.
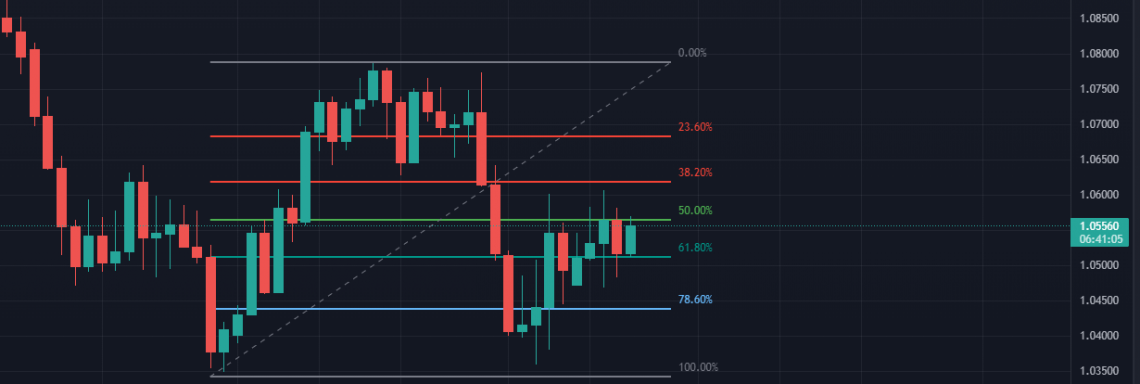
Fibonacci Retracement/Extension
Fibonacci retracement is another technical indicator to identify potential support and resistance. The lines are represented as percentages, including 23.6, 38.2, 61.8, and 78.6. The retracement is calculated between two significant high and low points drawn by the analyst.
The Fibonacci extension is the same tool but in reverse, where the percentage increase is examined at resistance points.
If the stock price is $10 and drops by $2.36, it has met the first Fibonacci percentage, 23.6%, which can be identified as a support line.
The percentages are not from any known formula. Instead, they are derived from the golden ratio, a string of numbers that form these percentages when divided in a sequential pattern. It is observed in nature, from DNA to astrology; hence there is a belief that it may have relevance to the financial markets.


or Want to Sign up with your social account?