Sell in May and Go Away
A phrase used in finance that suggests the stock market underperforms from May to October.


What Is "Sell in May and Go Away"?
"Sell in May and go away" is a phrase used in finance that suggests the stock market underperforms from May to October. But why would an investor sell specifically at this time? Are there any studies that back this adage?
This article will show the meaning and history behind the famous finance phrase.
What does it mean to “Sell in May and Go Away”?
- This adage was popularized by the Stock Trader’s Almanac, which suggested that stocks tend to sell off from May to October.
- The book found that investing in stocks from November to April and switching to fixed income the other six months of the year would have produced “reliable returns with reduced risk since 1950.”
- Based on historical data from the book, investors may try to profit from the pattern by alternating into fixed-income assets from May to October.
- "Sell in May and go away" is a saying that advises investors to sell their stocks in May and wait until the historically weaker summer months have passed before re-entering the market, typically around November.
- The strategy reflects behavioral finance theories in which investor psychology and seasonal factors influence market performance, with summer vacations and lower institutional investor participation believed to contribute to this phenomenon.
- Critics argue that the strategy oversimplifies market dynamics and that market timing based on calendar anomalies can lead to missed opportunities and higher transaction costs.
- Rather than completely exiting the market, some investors prefer to adjust their portfolios by shifting to defensive stocks, bonds, or other assets that are perceived to be more stable during the summer months.
The Evidence Of Sell In May And Go Away
Some facts and trends favor selling in May. Many other performance patterns are similar to this strategy. These performance patterns and theories are based on statistical and historical evidence.
These similar patterns and strategies include the October Crash, the Santa Claus Rally, and the Quarterly Triple Witching.
While many long-term investors have been skeptical of these strategies, some short-term swing traders take advantage of these cyclical patterns.
To date, the three worst-performing days in stock market history occurred in October. Two of the three days occurred during the crash of 1929, and the third was the 1987 Black Monday crash in October.
From 1990 to 2022, the S&P 500 averaged about 2% from May through October, while November through April averaged about 7%.
One Study SSRN found that selling in May and staying away through October held in 97% of developed and emerging market economies from 1970-1998.
The period from 2013 to today has not supported this theory, especially considering the sharp reversal uptrend in 2020, coming off the pandemic, when the S&P 500 index rose 63% in price from March 23 to September 3, 2020.
Other Similar Strategies
If you are a short-term, seasonal investor looking for other strategies similar to "sell in May and go away," we have compiled a list.
Santa Claus Rally
The Santa Claus rally is a seasonal pattern that suggests a rise in stock prices during the last five trading days of December and the first two trading days in January.
According to Stock Trader’s Almanac, the stock market has risen an average of 1.3% during the seven trading days mentioned above since 1950 and 1969.
The October Crash
It may not be a coincidence that October, also recognized as the month when the most dramatic stock market crashes occur, is the final month in the cyclical cycle known as "sell in May and go away."
The "October effect" is psychological to some extent because previous crashes like Black Friday in 1929 and Black Monday in 1987 happened in October are always on investors' minds.
However, October also comes after September, the month with the lowest annual performance on average.
The Quarterly Triple Witching
The so-called “triple witching” is a market phenomenon that occurs four times per year in the stock market. It refers to the simultaneous expiration of options, stock index futures, and stock index options.
This phenomenon, known as "triple witching," happens four times a year. Interestingly, it has the potential to produce extremely high stock market volatility, making it a seasonal anomaly that traders should be aware of.
Every year, on the third Friday of March, June, September, and December, the stock market experiences triple switching.
The Halloween Indicator
An alternative and similar strategy to “Sell in May and go Away” is known as the Halloween Indicator or the “Buy in October and sell in May” strategy.
This strategy suggests that investors buy up equities after the end of October, coinciding with Halloween. Conversely, the strategy suggests that investors sell at the beginning of May to complete the cycle.
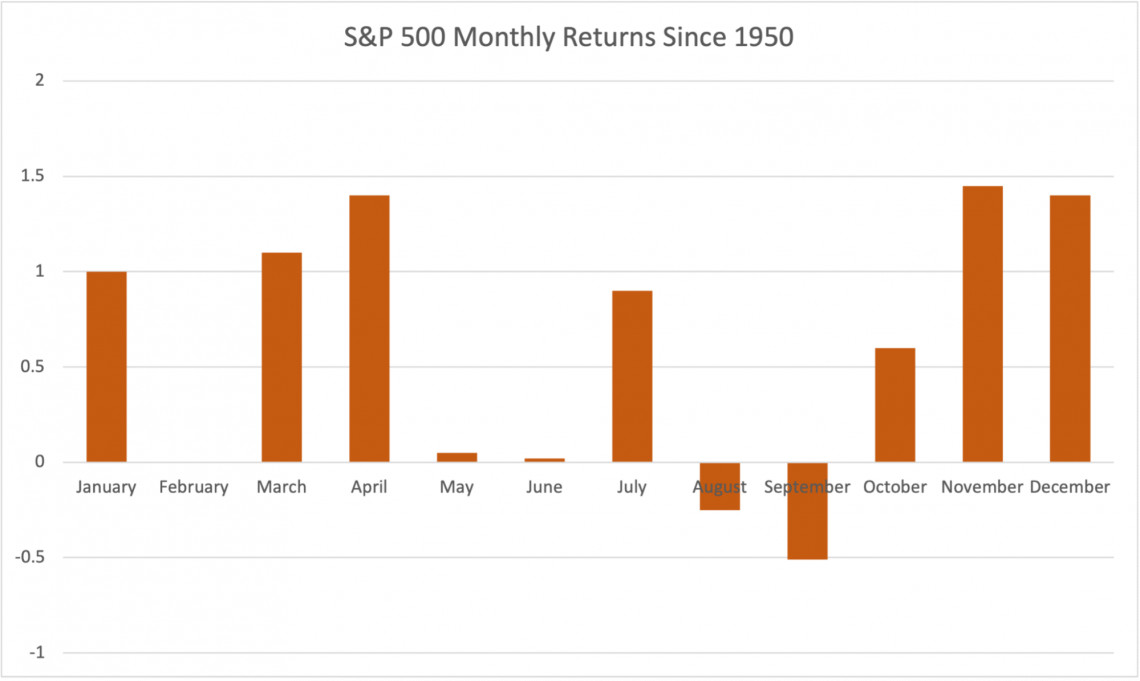
What is the Best Month to Buy Stocks? The beginning of the year and the summer months are often when the markets have the strongest returns. According to Newtraderu, The S&P 500's monthly average returns are depicted below:
Is "Sell in May and go away" a Good Strategy?
So should you "sell in May and move away"? According to historical data, it's unlikely that you should follow this strategy because there might be better alternatives if you are a seasoned investor.
However, If you have a longer-term horizon, always remember a time in the market beats timing the market.
The “sell in May” strategy has worked in the past; however, it is not ideal for long-term investors and tends to be a strategy for short-term, seasoned investors.
There's a saying among long-term investors: "Time in the market beats timing the market." This is because timing the market is incredibly difficult, and traders who attempt to “buy the bottom” often miss many market gains.
At the end of the 45-year term, an investor can achieve a significantly higher level of wealth by simply remaining invested in the index. For example, a $10,000 investment into the index in 1978 would be worth about $480,000 more today than the “Sell in May, Go Away” strategy.
Given recent events and the market's development, some would claim that this period is unique. This may be the case, but timing the market is very difficult, regardless of the era.
Sell In May And Go Away FAQs
Instead of making tactical changes to your portfolio, it might be worth your time to reevaluate how much risk you can comfortably take on and adjust your asset allocation accordingly (the ratio of stocks to bonds).
It is a much more efficient use of your time to rebalance your portfolio to ensure that your asset mix is consistent with your risk profile. Additionally, rebalancing your portfolio organically evens the cost of each security you own.
You can increase your purchases of assets that have decreased in value (averaging down) and decrease your sales of securities that have increased in value during the rebalancing process (taking some profits).

Free Resources
To continue learning and advancing your career, check out these additional helpful WSO resources:


or Want to Sign up with your social account?