HFP Capital Markets Overview
HFP Capital Markets Job Openings
No jobs found.
HFP Capital Markets Stats
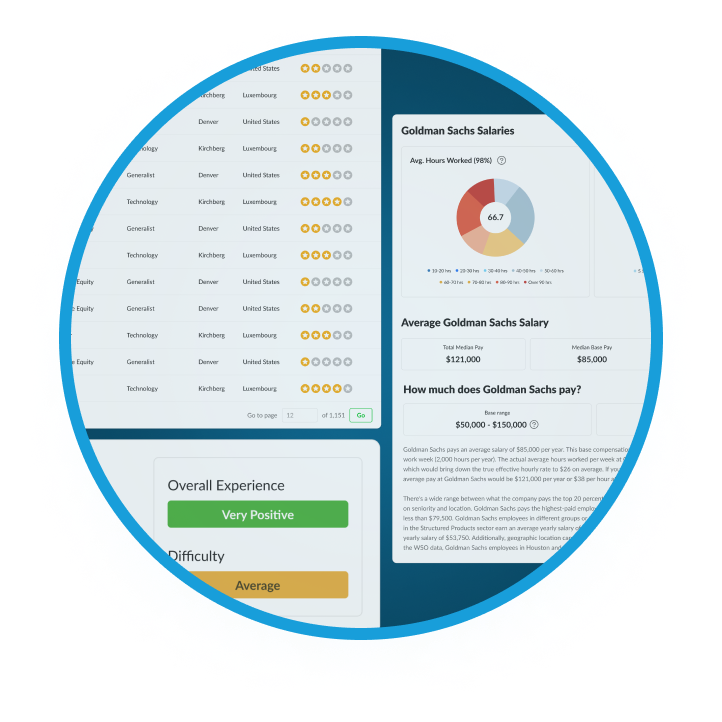
The average hours worked chart shows the distribution of average hours worked per week generated based on the Compensation data at this company.
The number you see in the middle of the doughnut pie chart is the adjusted average of these scores. If you hover over the various sections of the donut, you will see the % breakdown of each workload given.
The percentile score in the title is calculated across the entire Company Database and uses an adjusted score based on Bayesian Estimates (to account for companies that have few interview insights). Simply put, as a company gets more data points, the confidence of a "true measure" increases so it is pulled closer to its simple average and away from the average of the entire dataset.
- 10-20 Hrs
- 20-30 Hrs
- 30-40 Hrs
- 40-50 Hrs
- 50-60 Hrs
- 60-70 Hrs
- 70-80 Hrs
- 80-90 Hrs
- Over 90 Hrs
The Interview Experience is a score from 1 star (very negative) to 5 stars (very positive) generated based on the Interview Insights at this company.
The number you see in the middle of the doughnut pie chart is the simple average of these scores. If you hover over the various sections of the donut, you will see the % breakdown of each score given.
The percentile score in the title is calculated across the entire Company Database and uses an adjusted score based on Bayesian Estimates (to account for companies that have few interview insights). Simply put, as a company gets more reviews, the confidence of a "true score" increases so it is pulled closer to its simple average and away from the average of the entire dataset.
- Very Negative
- Negative
- Neutral
- Positive
- Very Positive
The Interview Difficulty is a score ranging from very difficult (red) to very easy (green) generated based on the Interview Insights at this company.
The number you see in the middle of the doughnut pie chart is the simple average of these scores. The higher the number, the more difficult the interviews on average. If you hover over the various sections of the doughnut, you will see the % breakdown of each score given.
The percentile score in the title is calculated across the entire Company Database and uses an adjusted score based on Bayesian Estimates (to account for companies that have few interview insights). Simply put, as a company gets more insights, the confidence of a "true score" increases so it is pulled closer to its simple average and away from the average of the entire data set.
- Very Easy
- Easy
- Average
- Difficult
- Very Difficult
The Military Friendly chart shows the % of interviewed candidates that were in a military program or involved in the military at some point. If you hover over the the pie chart, you will see the % breakdown of military and non-military candidates.
The percentile score in the title is calculated across the entire Company Database and uses an adjusted score based on Bayesian Estimates (to account for companies that have less data).
Simply put, as a company gets more interviews, the confidence of a "true score" increases so it is pulled closer to the simple company average and away from the average of the entire data set.
The higher the percentile, the more likely this company is to grant an interview to someone with a military background.
- Yes
- No
The Sports Matters? chart shows the % of interviewed candidates that played a varsity sport in their undergraduate university. If you hover over the the pie chart, you will see the % breakdown by Varsity Athletes and Non-varsity athletes. The percentile score in the title is calculated across the entire Company Database and uses an adjusted score based on Bayesian Estimates (to account for companies that have less data).
Simply put, as a company gets more interviews, the confidence of a "true score" increases so it is pulled closer to the simple company average and away from the average of the entire data set.
The higher the percentile, the more likely this company is to grant an interview to a varsity athlete based on our data.
- Yes
- No
Company Details
HFP Capital Markets LLC, headquartered in New York City, is a wholly owned subsidiary of Hudson Financial Partners LLC. We are a full service investment bank providing a wide range of investment products and investment banking services to a diversified client base that includes corporations, financial institutions, and high net worth individuals.
As a full service investment bank, we are able to offer a broad spectrum of value-added services to micro-cap and emerging growth companies. Our seasoned professionals draw on significant industry experience and work side by side with company management acting as a strategic partner to provide advisory services and access to capital.
At HFP, we assist our wealth management clients in structuring investment portfolios to meet their objectives and offer personalized services and an array of products to suit individual needs.
We are dedicated to creating long-term value for our corporate and wealth management clients and demand the highest level of integrity from all members of the firm. We believe that these high standards, coupled with our experience and insight, set us apart from others in our industry.
Customer accounts are cleared through Penson Financial Services, Inc.; we are a member of the Financial Industry Regulatory Authority (FINRA) and Securities Investor Protection Corporation (SIPC).
We invite you to build a dedicated relationship with one of our private client representatives or, if a growing corporation, with our Investment Banking team.
Locations
WSO Company Database Comparison Table
HFP Capital Markets Interview Questions
or Want to Sign up with your social account?