
Quantitative Strategist
Status
Vice President at
Group/Division/Type
Equity Capital Markets
City
NA
Interviewed
August 2020
Overall experience
Difficulty
General Interview Information
Outcome
No Offer
Interview Source
Applied Online
Length of Process
Less than 1 month
Interview Details
What did the interview consist of?
Phone Interview
1 on 1 Interview
Please describe the interview / hiring process.
Applied online for this VP level position and got 4 rounds of interviews within a month. The first 3 rounds are with ED and the last round with MD. All questions based on resume nothing like difficult technical questions. Their team both develop algo trading strategy and execute them so you need to know both Python and Java well. Didn't get the offer because I wasn't senior enough and they have someone already being a VP from another bank.
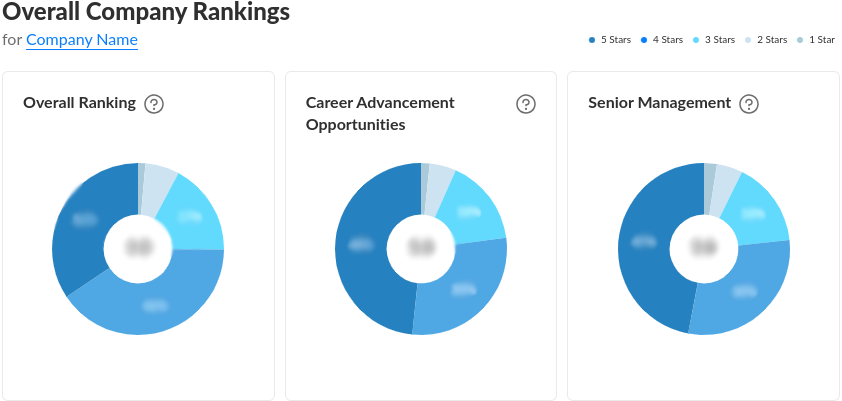
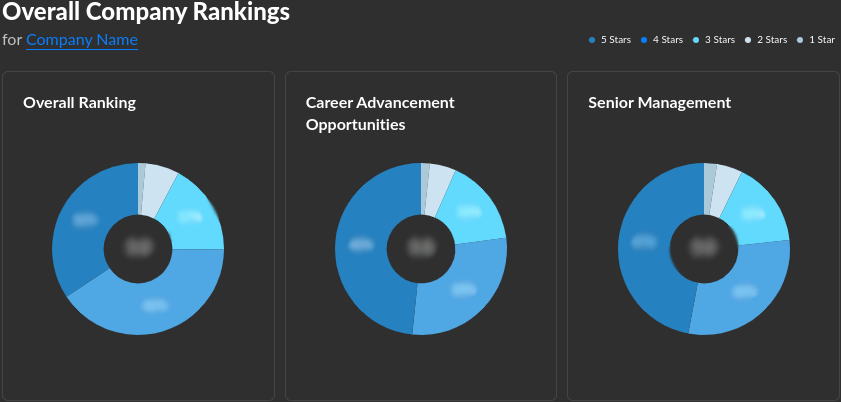
Want Access to these Morgan Stanley Overall Company Rankings?
- Free 1 month access by adding just 1 salary datapoint here
- REAL salary bonus data across 1,000+ companies
- Plus free 1 month access to 10,000+ interview insights
Was this interview insight helpful?
How many stars would you give to this interview insight?


or Want to Sign up with your social account?