
CIB Summer Analyst
Status
Intern at
Group/Division/Type
Investment Banking
City
Charlotte
Interviewed
September 2023
Overall experience
Difficulty
General Interview Information
Outcome
Accepted Offer
Interview Source
College / University / On Campus Recruiting
Length of Process
1-2 months
Interview Details
What did the interview consist of?
Phone Interview
Group Interview
Please describe the interview / hiring process.
The first round was an on-campus interview where I was interviewed by a school alumnus and an MD. The interviewers were mainly focused on behaviorals, but the last ten minutes or so were technical focused. None of the questions were very difficult, mainly just why Regions and the technical were all debt focused (i.e why and when would a company raise debt vs equity). The next round was a superday which consisted of being interviewed by 3 teams of 4 that were all made up from different coverage and product groups, which had a higher focus on technicals.
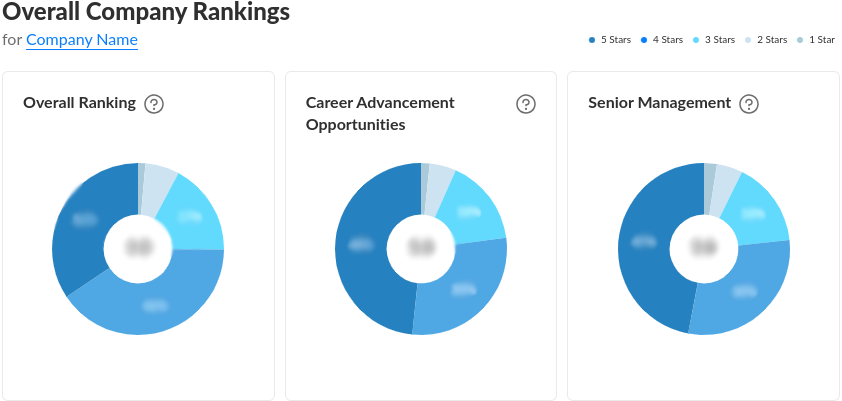
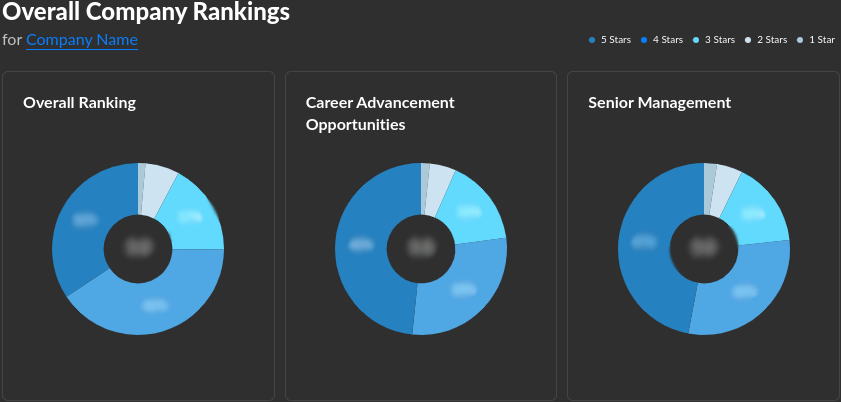
Want Access to these Regions Bank Overall Company Rankings?
- Free 1 month access by adding just 1 salary datapoint here
- REAL salary bonus data across 1,000+ companies
- Plus free 1 month access to 10,000+ interview insights
Was this interview insight helpful?
How many stars would you give to this interview insight?


or Want to Sign up with your social account?